Open Access
Fig. 7
Download original image
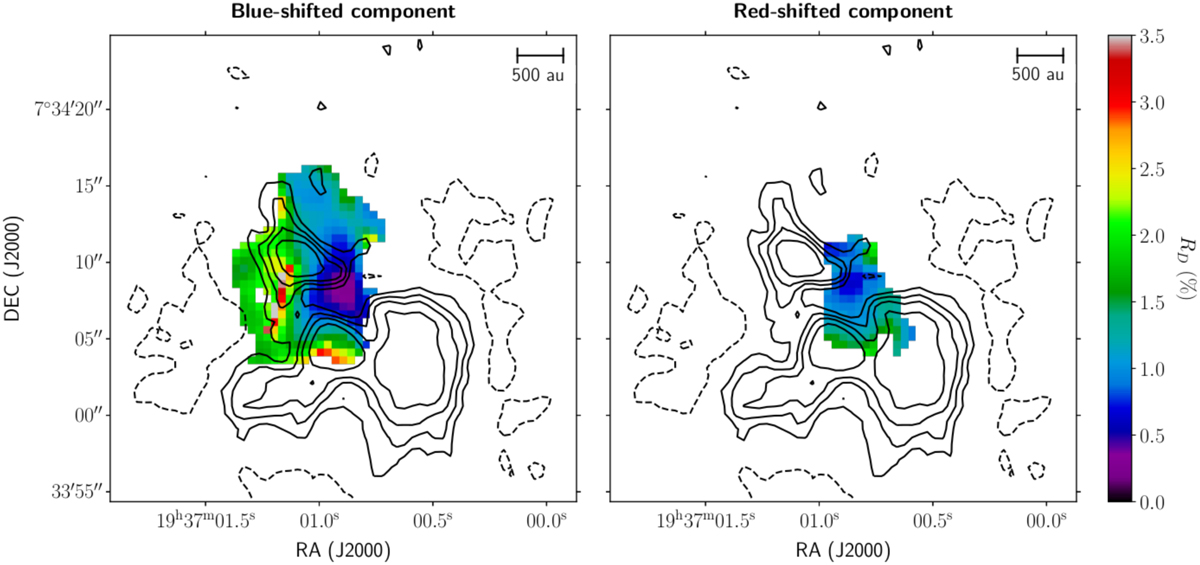
Deuteration fraction maps for the blue- and redshifted velocity components (left and right columns, respectively). The N2D+ (J = 3–2) integrated emission is shown overlaid as black contours at 3, 5, 10, 15, and 20σ, where σ = 5.23 mJy beam−1. The spatial scale is shown in the top-right corners of each panel.
Current usage metrics show cumulative count of Article Views (full-text article views including HTML views, PDF and ePub downloads, according to the available data) and Abstracts Views on Vision4Press platform.
Data correspond to usage on the plateform after 2015. The current usage metrics is available 48-96 hours after online publication and is updated daily on week days.
Initial download of the metrics may take a while.