Fig. 6
Download original image
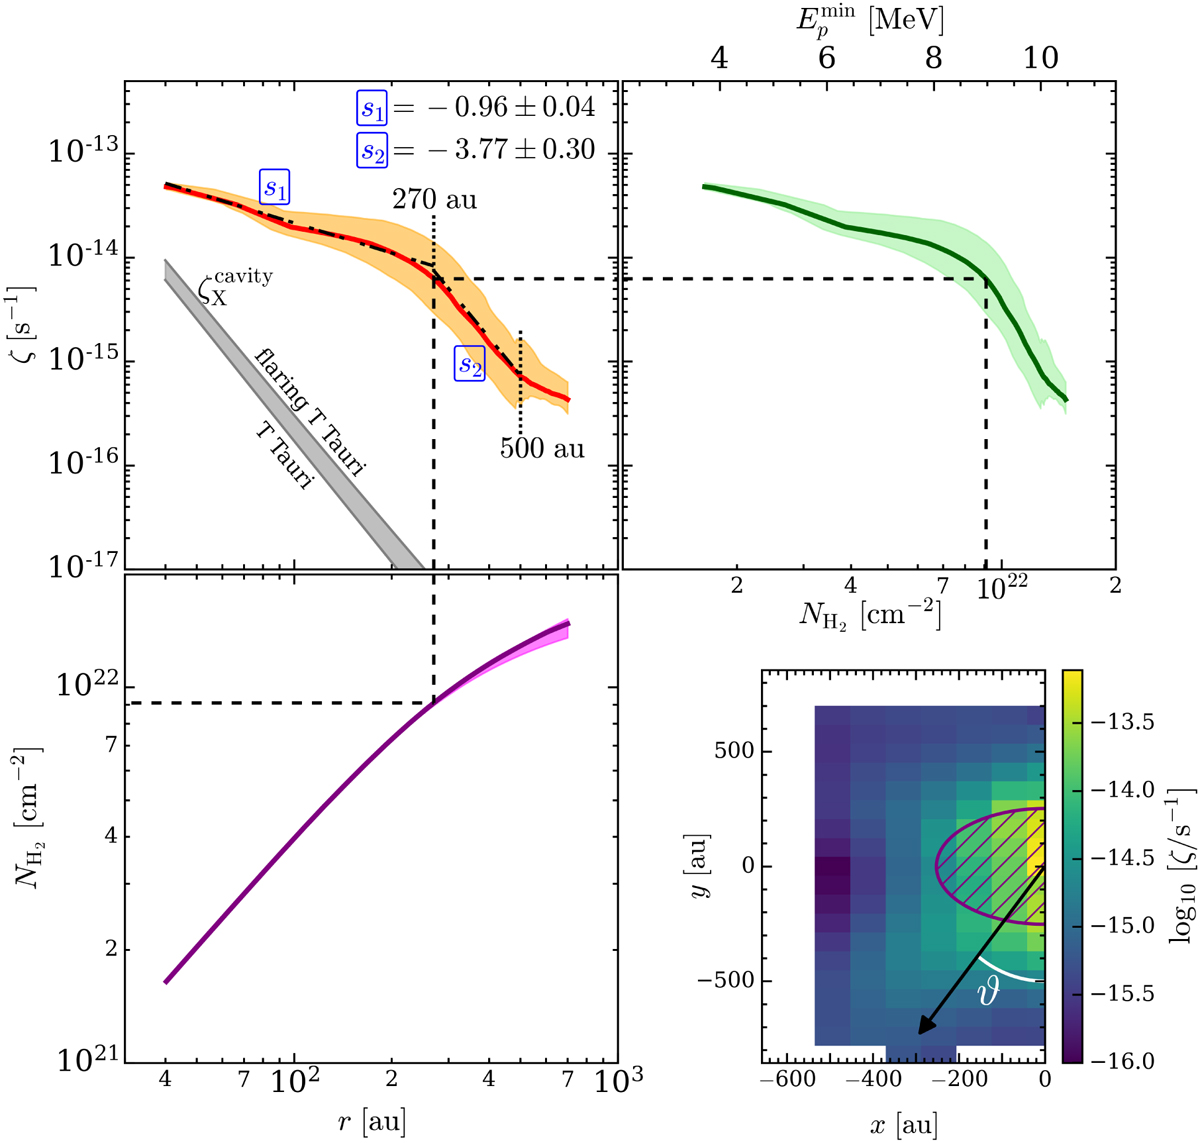
Upper left panel: ζCR as a function of the radius, r. The two dotted black lines at 270 and 500 au identify the radius ranges used to compute the slopes (s1 and s2, respectively). The gray shaded region shows the expected X-ray ionization in the outflow cavity for a typical and a flaring T Tauri star (Rab et al. 2017). Lower left panel: hydrogen column density, ![]() , from the source center outwards as a function of radius. Upper right panel: ζCR as a function of the H2 column density. The upper x-axis shows the minimum energy that CR protons must have in order not to be thermalized (Padovani et al. 2018). The orange, magenta, and green filled regions in the three upper panels represent the envelope of the ζCR and
, from the source center outwards as a function of radius. Upper right panel: ζCR as a function of the H2 column density. The upper x-axis shows the minimum energy that CR protons must have in order not to be thermalized (Padovani et al. 2018). The orange, magenta, and green filled regions in the three upper panels represent the envelope of the ζCR and ![]() profiles (see Sect. 5.2), while the red, purple, and dark green solid lines show their median value. Lower right panel: ζCR map of the blueshifted component (zoom of the upper left panel of Fig. 5) in logarithmic scale (colored map). The purple hatched region shows a circle of radius 270 au, where CRs propagate according to the diffusive regime. For illustration purposes, the black arrow at the position angle # shows a direction used to extract the ζCR profile from the map. The black dashed lines identify the radius as well as the corresponding values of
profiles (see Sect. 5.2), while the red, purple, and dark green solid lines show their median value. Lower right panel: ζCR map of the blueshifted component (zoom of the upper left panel of Fig. 5) in logarithmic scale (colored map). The purple hatched region shows a circle of radius 270 au, where CRs propagate according to the diffusive regime. For illustration purposes, the black arrow at the position angle # shows a direction used to extract the ζCR profile from the map. The black dashed lines identify the radius as well as the corresponding values of ![]() and ζCR, where the slope of ζCR changes from s1 to s2.
and ζCR, where the slope of ζCR changes from s1 to s2.
Current usage metrics show cumulative count of Article Views (full-text article views including HTML views, PDF and ePub downloads, according to the available data) and Abstracts Views on Vision4Press platform.
Data correspond to usage on the plateform after 2015. The current usage metrics is available 48-96 hours after online publication and is updated daily on week days.
Initial download of the metrics may take a while.