Open Access
Fig. 3
Download original image
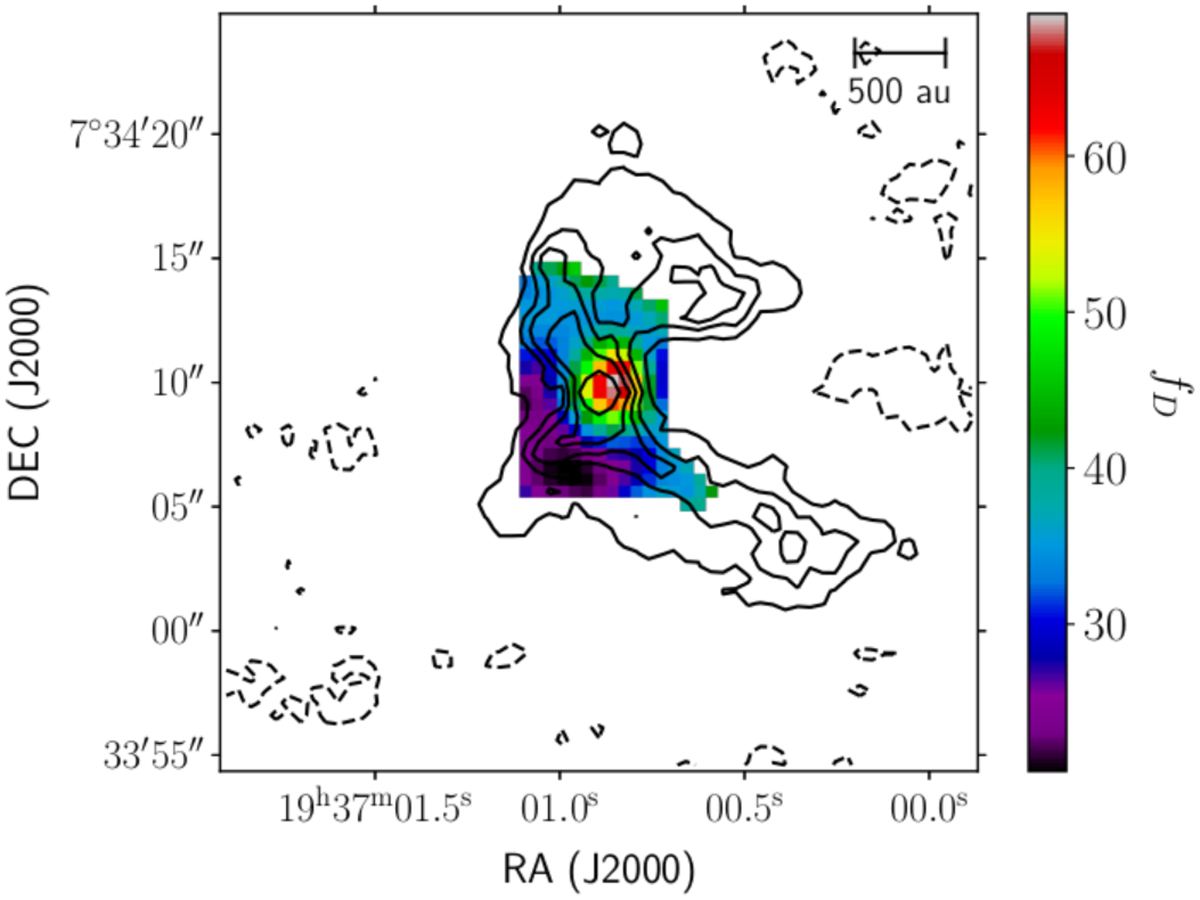
Map of the CO depletion factor and contours of dust continuum emission at 110 GHz, for emission over 3σ. The spatial scale is shown in the top-right corner of the figure.
Current usage metrics show cumulative count of Article Views (full-text article views including HTML views, PDF and ePub downloads, according to the available data) and Abstracts Views on Vision4Press platform.
Data correspond to usage on the plateform after 2015. The current usage metrics is available 48-96 hours after online publication and is updated daily on week days.
Initial download of the metrics may take a while.