Fig. B.4
Download original image
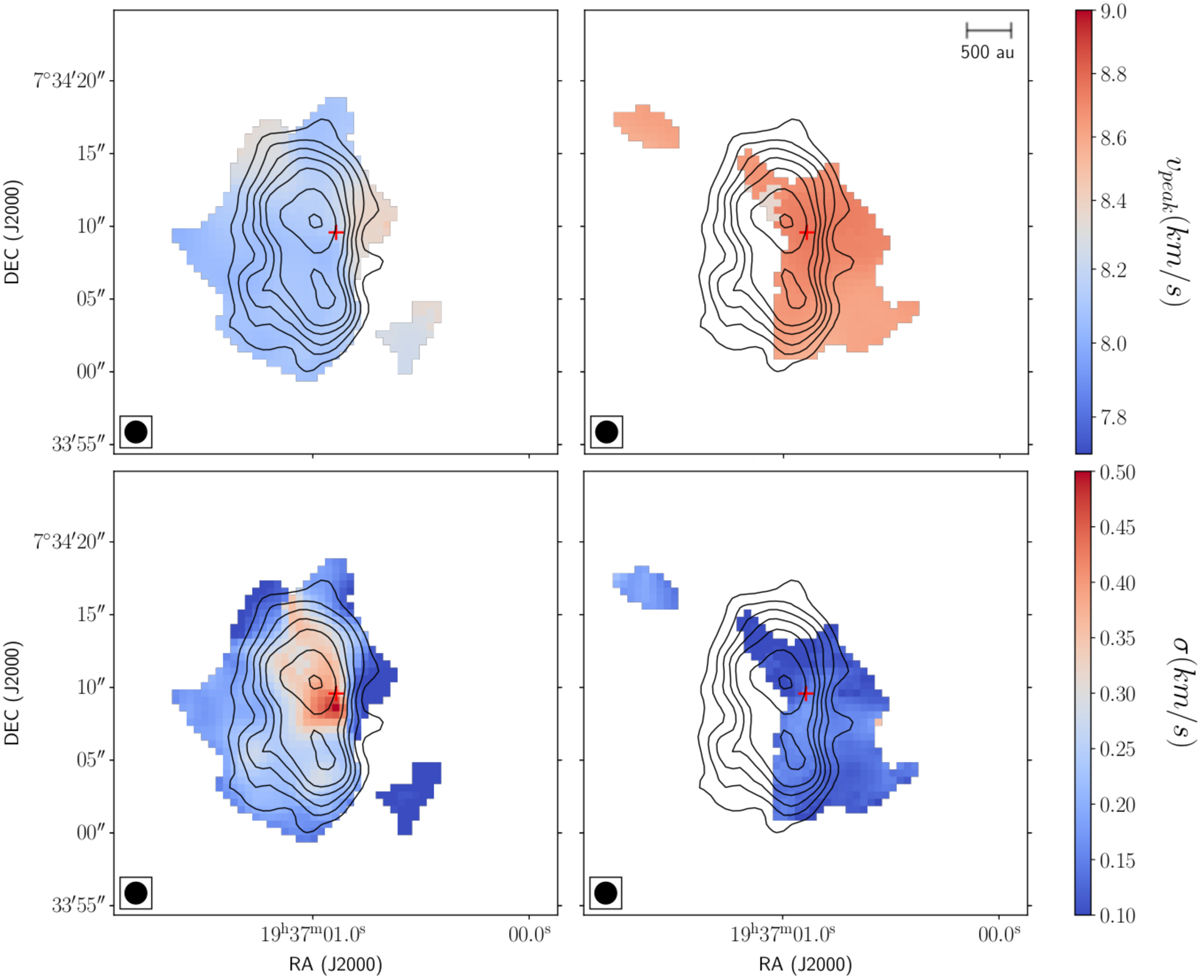
DCO+ (J=3–2) maps obtained from modeling the line profiles with two velocity components. Overlaid contours show the integrated intensity at −3, 3, 5, 10, and 20 σ. The top map shows values for the peak velocity and bottom show values for the line width (given as σ). Left and right show the blue- and redshifted component, respectively.
Current usage metrics show cumulative count of Article Views (full-text article views including HTML views, PDF and ePub downloads, according to the available data) and Abstracts Views on Vision4Press platform.
Data correspond to usage on the plateform after 2015. The current usage metrics is available 48-96 hours after online publication and is updated daily on week days.
Initial download of the metrics may take a while.