Fig. 1
Download original image
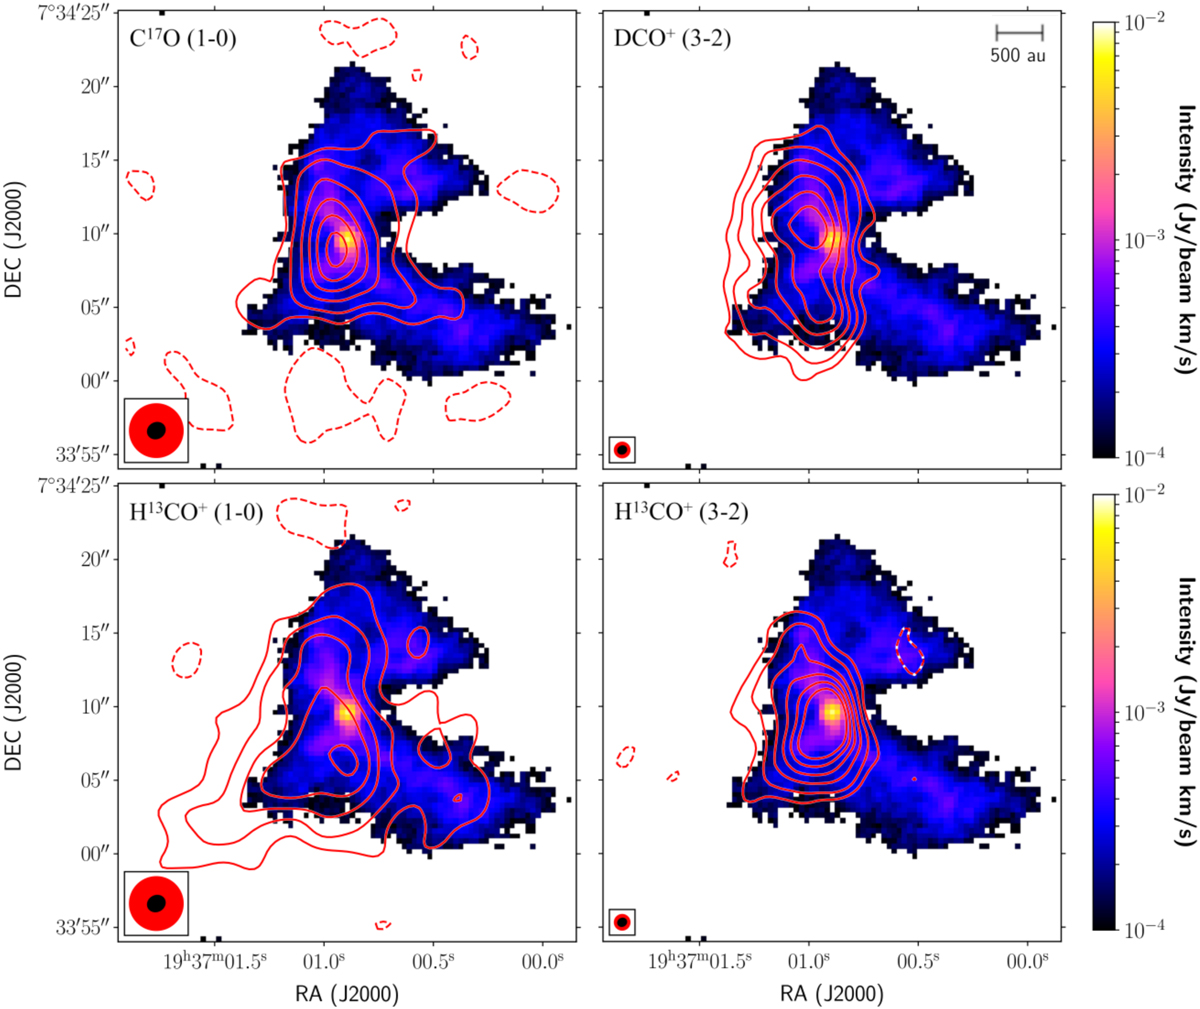
Map of the dust continuum emission at 110 GHz clipped for values smaller than 3σ (see Table 1) and integrated emission for the four molecular lines as indicated in the upper left corner (red contours). Contours are −2, 3, 5, 8, 11, 14, and 17σ (the individual σ values are indicated in Table 1). The velocity ranges used to obtain the integrated intensity maps are shown in Table 1. In the bottom-left of each plot, we show the beam size for each molecular line (in red) and for the dust continuum emission (in black). The physical scale is shown in the top-right corner of the figure.
Current usage metrics show cumulative count of Article Views (full-text article views including HTML views, PDF and ePub downloads, according to the available data) and Abstracts Views on Vision4Press platform.
Data correspond to usage on the plateform after 2015. The current usage metrics is available 48-96 hours after online publication and is updated daily on week days.
Initial download of the metrics may take a while.