Fig. A.2.
Download original image
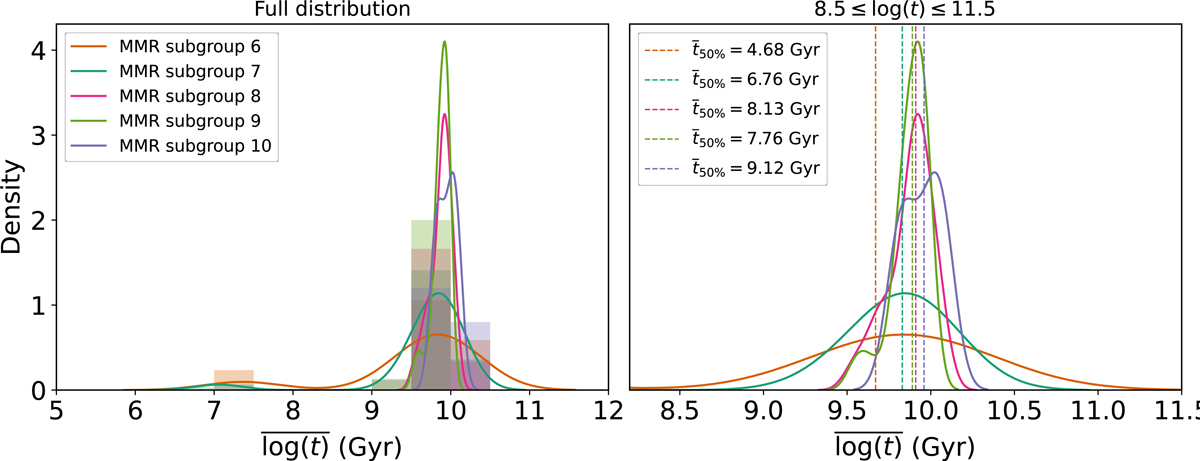
Distribution of ages for all MMR subgroups in terms of density. Left panel: Entire distribution with both histograms and 1D Gaussian kernel density plots, including the outliers of younger age. Right panel: Similar to the left panel, but without the histograms and zoomed in within 8.5≤log(t)≤ 11.5. Additional vertical lines are added to depict the medians of each distribution (with symbol ![]() for the 50th percentile of the age distribution), with the same corresponding colours for each MMR subgroup.
for the 50th percentile of the age distribution), with the same corresponding colours for each MMR subgroup.
Current usage metrics show cumulative count of Article Views (full-text article views including HTML views, PDF and ePub downloads, according to the available data) and Abstracts Views on Vision4Press platform.
Data correspond to usage on the plateform after 2015. The current usage metrics is available 48-96 hours after online publication and is updated daily on week days.
Initial download of the metrics may take a while.