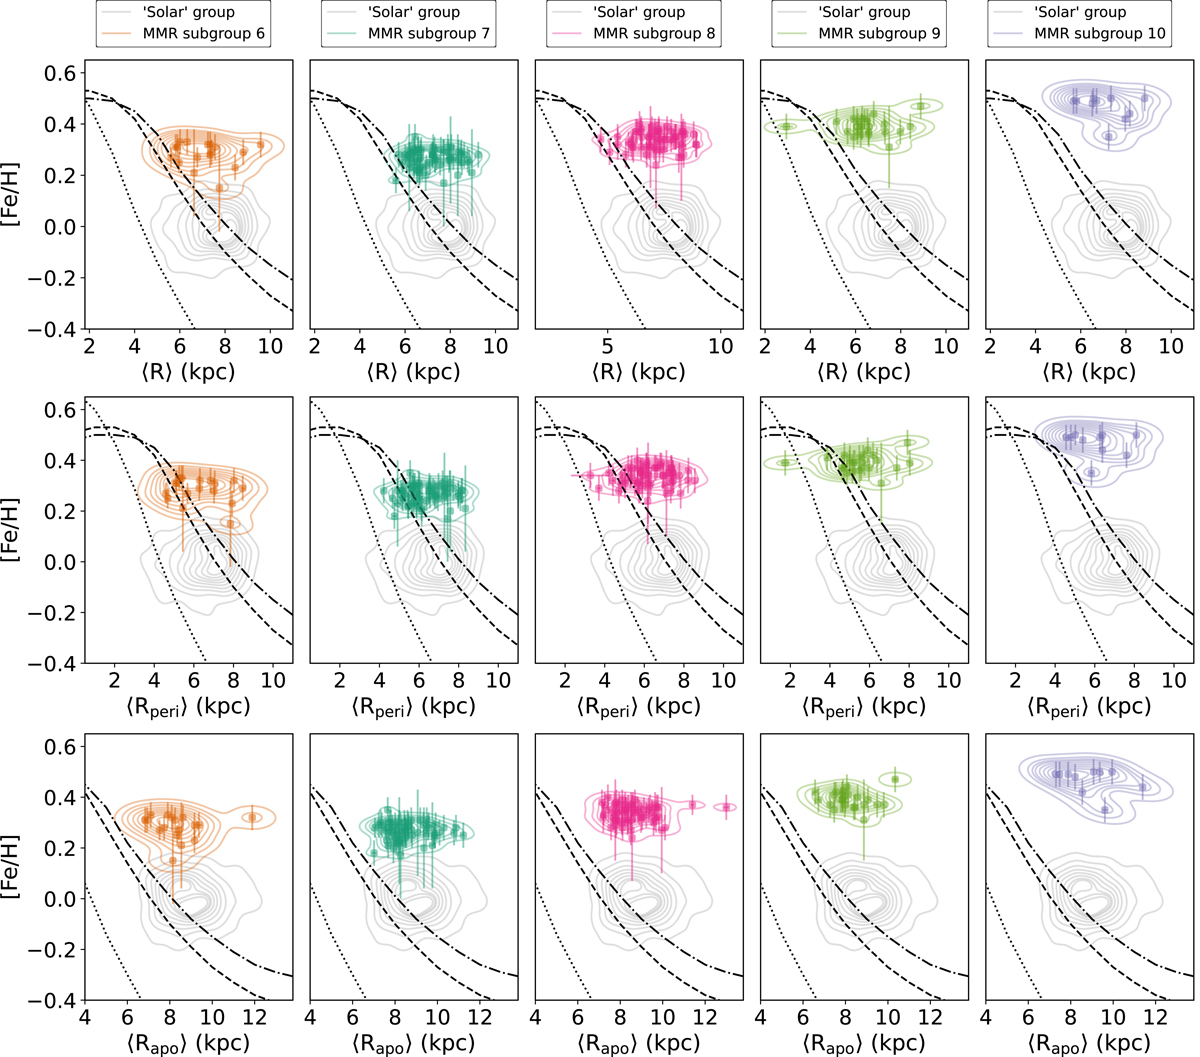
Fig. 7.
Download original image
[Fe/H] vs. ⟨R⟩ (top), ⟨Rperi⟩ (middle), and ⟨Rapo⟩ (bottom) for all stars in each MMR subgroup; their 2D-Gaussian kernel densities are also displayed along with those from the Solar group. The dotted, dashed, and dot-dashed black curves respectively depict the 3.3, 8, and 11 Gyr models described in Magrini et al. (2009). In all MMR subgroups, the values of [Fe/H] are very high even at large radii. Note that for each case (⟨R⟩, ⟨Rperi⟩, and ⟨Rapo⟩) the x-axis range is not the same to enable a better visualisation of the groups.
Current usage metrics show cumulative count of Article Views (full-text article views including HTML views, PDF and ePub downloads, according to the available data) and Abstracts Views on Vision4Press platform.
Data correspond to usage on the plateform after 2015. The current usage metrics is available 48-96 hours after online publication and is updated daily on week days.
Initial download of the metrics may take a while.