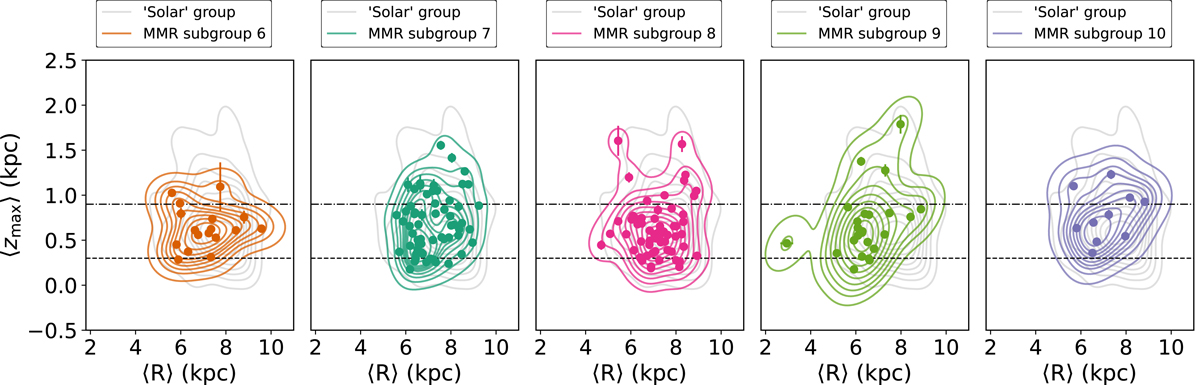
Fig. 5.
Download original image
Median highest position in the plane of the MW vs. median guiding radius, both in kpc, (⟨Zmax⟩ vs. ⟨R⟩) for the five MMR subgroups (in the same colours as Fig. 2) in the shape of 2D kernel density plots with their respective scatter markers. The Solar group parameters are shown in grey for comparison. No star has negative ⟨Zmax⟩, but the images have been enlarged up to ⟨Zmax⟩= − 0.5 for better visualisation of the density curves. As a visual guide, the thin and thick discs thresholds are shown as black dashed and dot-dashed lines, respectively.
Current usage metrics show cumulative count of Article Views (full-text article views including HTML views, PDF and ePub downloads, according to the available data) and Abstracts Views on Vision4Press platform.
Data correspond to usage on the plateform after 2015. The current usage metrics is available 48-96 hours after online publication and is updated daily on week days.
Initial download of the metrics may take a while.