Fig. 4.
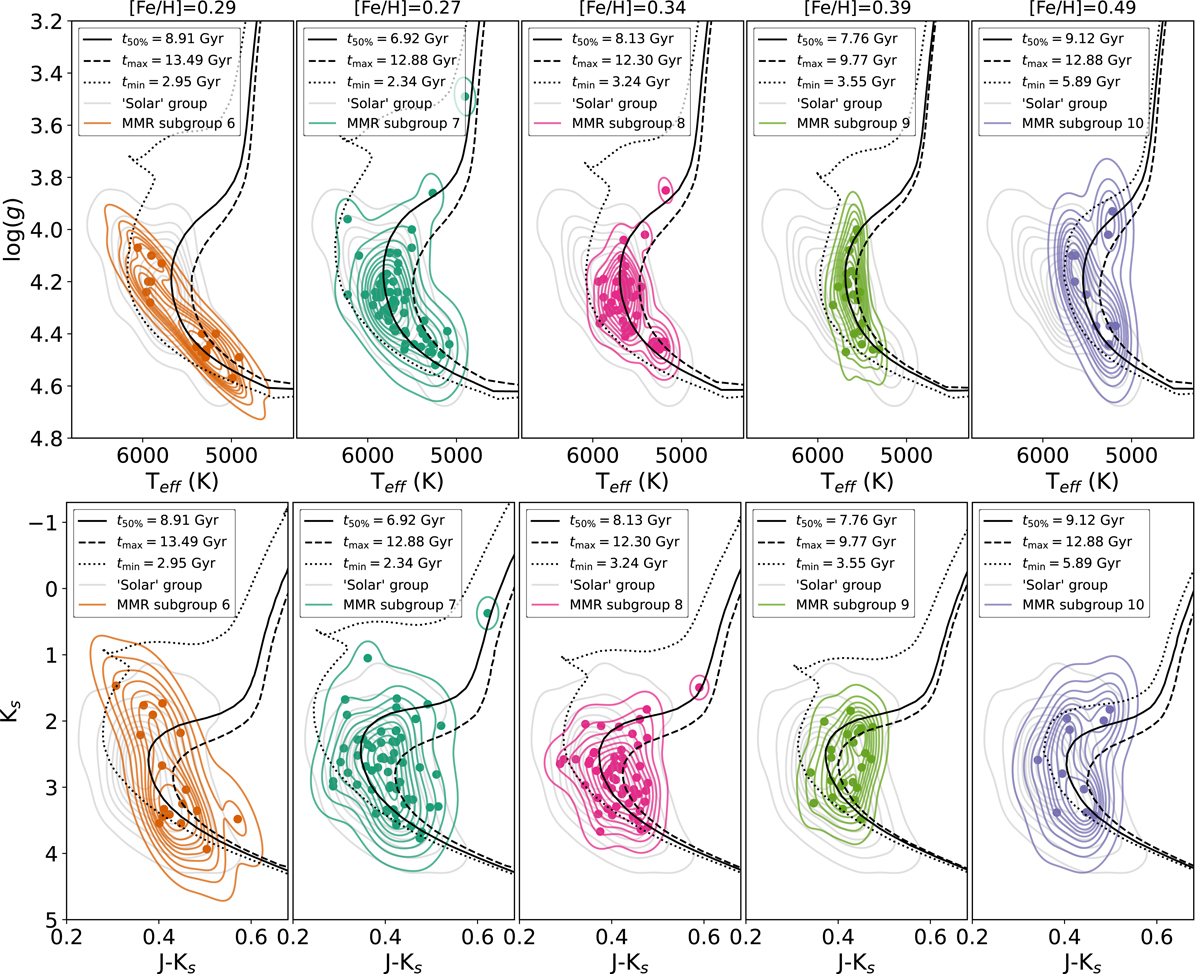
Download original image
Kiel and colour-magnitude diagrams for each of the MMR subgroups. Top panel: surface gravity vs. effective temperature [log(g) vs. Teff] for the five MMR subgroups, in the same colours as Fig. 2, in the shape of 2D kernel density plots with their respective scatter markers. In grey we display the Solar group parameters for comparison. Isochrones for the maximum, median, and minimum ages (according to Table 3) are also displayed as dashed, straight, and dotted lines, respectively. All isochrones shown are in terms of the median values of [Fe/H] shown in Table 1. The stars shown have a distribution of metallicities that are not shown in the isochrones. Bottom panel: equivalent CMD of the top panel. The CMD uses JHKs absolute magnitudes from 2MASS, which were used by UNIDAM to estimate the ages.
Current usage metrics show cumulative count of Article Views (full-text article views including HTML views, PDF and ePub downloads, according to the available data) and Abstracts Views on Vision4Press platform.
Data correspond to usage on the plateform after 2015. The current usage metrics is available 48-96 hours after online publication and is updated daily on week days.
Initial download of the metrics may take a while.