Fig. A.6.
Download original image
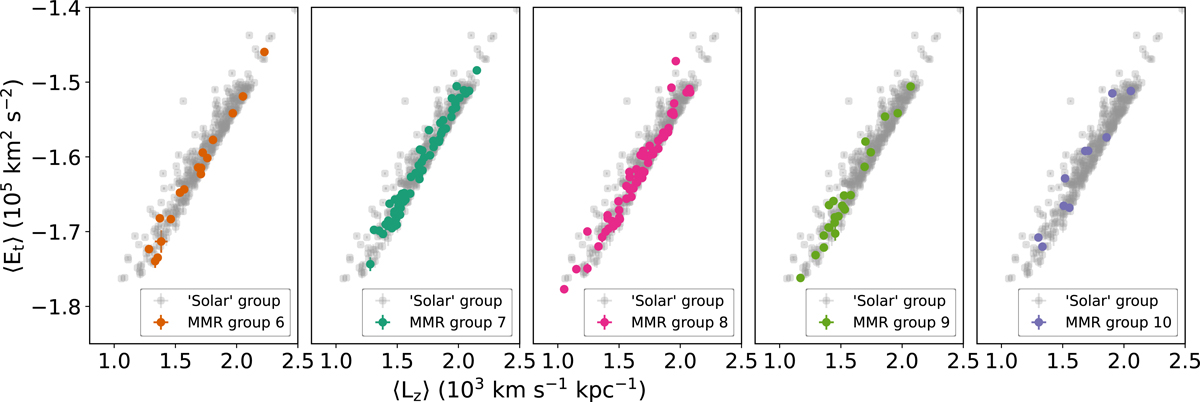
⟨Et⟩ vs. ⟨Lz⟩ (i.e. median total binding energy vs. median angular momentum on the z-axis of the MW, also known as the Lindblad diagram) for the five MMR subgroups (in the same colours as Fig. 2). The Solar group parameters are shown in grey for comparison. All stars seem to be in prograde movement, independently of their group classification, at several levels of binding energy.
Current usage metrics show cumulative count of Article Views (full-text article views including HTML views, PDF and ePub downloads, according to the available data) and Abstracts Views on Vision4Press platform.
Data correspond to usage on the plateform after 2015. The current usage metrics is available 48-96 hours after online publication and is updated daily on week days.
Initial download of the metrics may take a while.