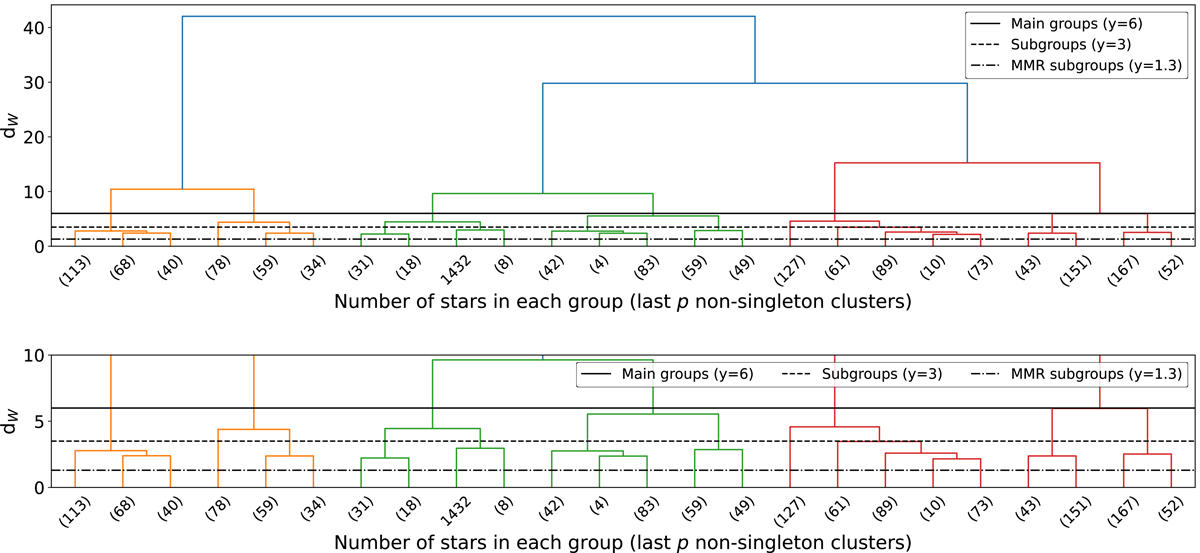
Fig. 1.
Download original image
Dendrogram with the hierarchical classification of the stars into groups. The solid line is for the main groups with Ward distance dW = 6; the dashed line is for the general subgroups with dW = 3. The dot-dashed line is for the MMR subgroups, established with dW = 1.3. The end of the dendrogram is truncated with the total number of stars in each branch shown on the x-axis. The numbers that appear on the x-axis are the final groups automatically detected by the dendrogram using the last p non-singleton clusters (p = 24) to facilitate visualisation (for more details, see the algorithm description in the SCIPY package, Virtanen et al. 2020). The number of stars in each MMR subgroup can also be seen in Table 1. Top panel: full dendrogram. Bottom panel: zoomed-in image of dendrogram to display the range 0 ≤ dW ≤ 10.
Current usage metrics show cumulative count of Article Views (full-text article views including HTML views, PDF and ePub downloads, according to the available data) and Abstracts Views on Vision4Press platform.
Data correspond to usage on the plateform after 2015. The current usage metrics is available 48-96 hours after online publication and is updated daily on week days.
Initial download of the metrics may take a while.