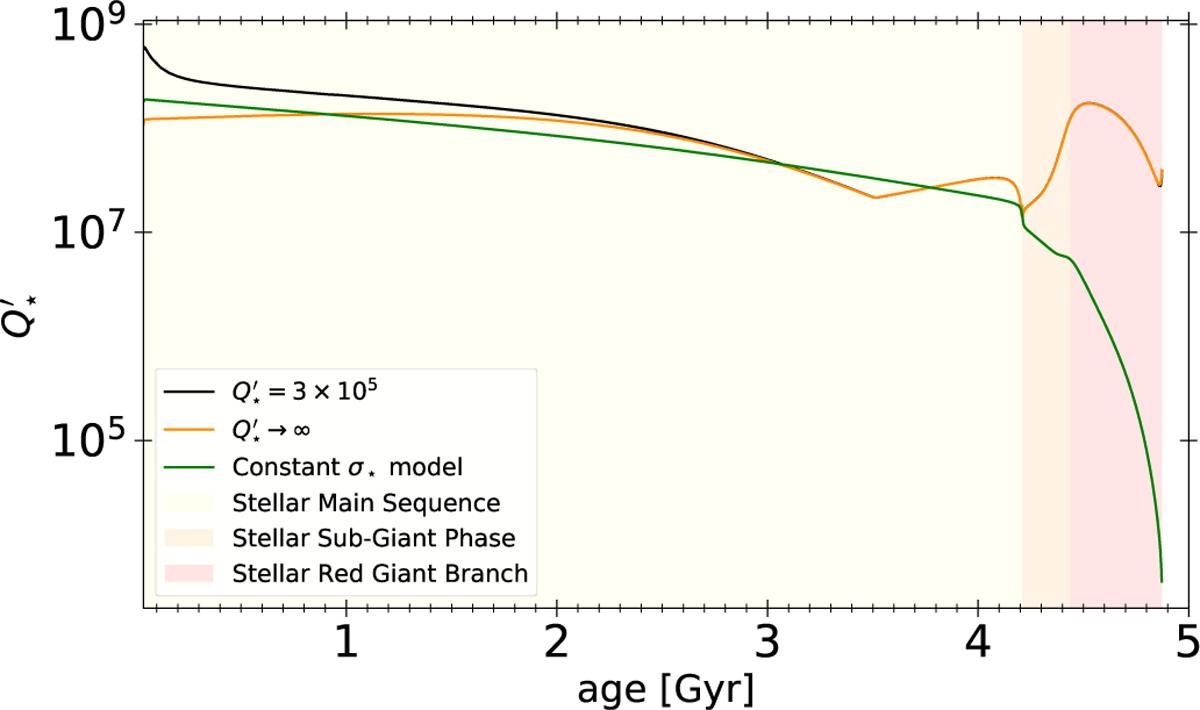
Fig. D.1
Download original image
Illustration of the evolution of Q′* as function of time for the different models considered. In orange our stellar model combined to the upper boundary of the planetary tidal dissipation found previously Q′* = 3 × 10⁵. In black our stellar model is combined to the lower value of the planetary dissipation Q′* → ∞. We can notice that the black and orange line are close to be superimposed. In green is represented the model with σ* = const, as done in Bolmont & Mathis (2016), the constant was calibrated at value in the MS (σ* = 5.536 × 10−66 at t = 0.83 Gyr). Finally the shaded areas correspond to the different evolutionary phases of the star, in yellow the MS, in orange, the sub-Giant phase, and in red the RGB phase.
Current usage metrics show cumulative count of Article Views (full-text article views including HTML views, PDF and ePub downloads, according to the available data) and Abstracts Views on Vision4Press platform.
Data correspond to usage on the plateform after 2015. The current usage metrics is available 48-96 hours after online publication and is updated daily on week days.
Initial download of the metrics may take a while.