Fig. 6
Download original image
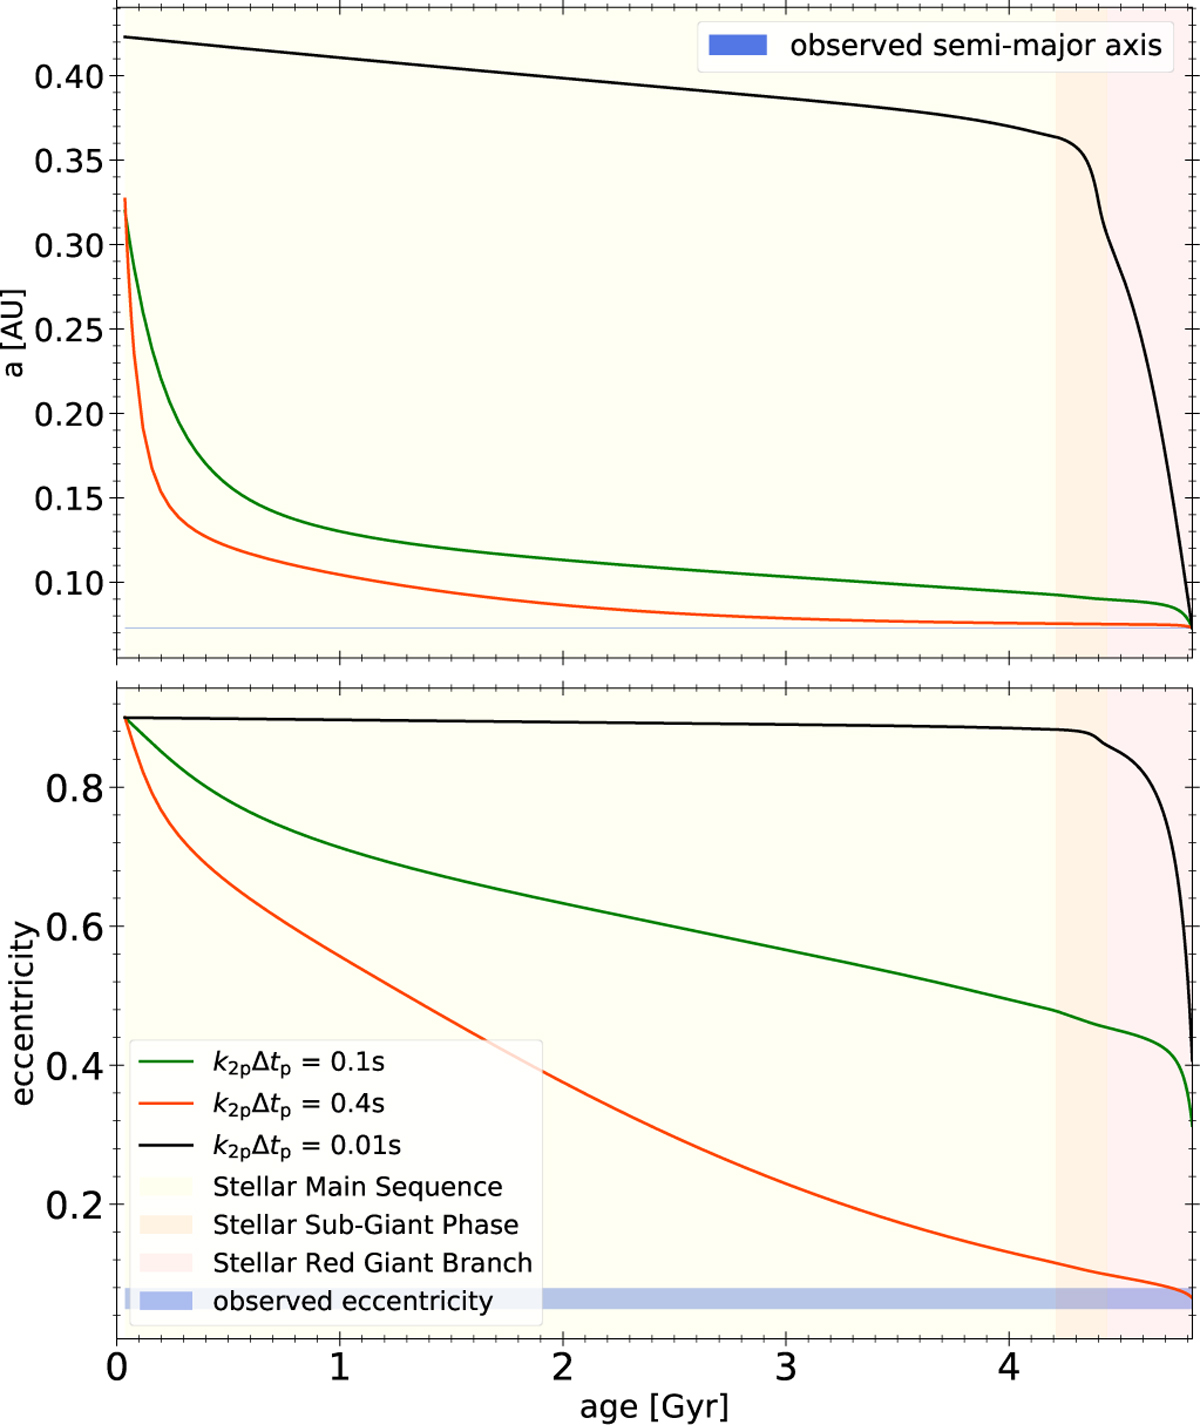
Evolution of the semi major axis and eccentricity as a function of time on, respectively, the top and bottom panel. Each curve represents the path taken by the planet with the different k2,p∆tp used in Fig. 5. The blue shaded areas are to the corresponding observed quantities. The yellow area corresponds to the stellar MS, the orange one is the stellar sub-Giant phase, and the red one is the stellar RGB phase. The age of the system corresponds to the end of these evolutionary sequences.
Current usage metrics show cumulative count of Article Views (full-text article views including HTML views, PDF and ePub downloads, according to the available data) and Abstracts Views on Vision4Press platform.
Data correspond to usage on the plateform after 2015. The current usage metrics is available 48-96 hours after online publication and is updated daily on week days.
Initial download of the metrics may take a while.