Fig. 1
Download original image
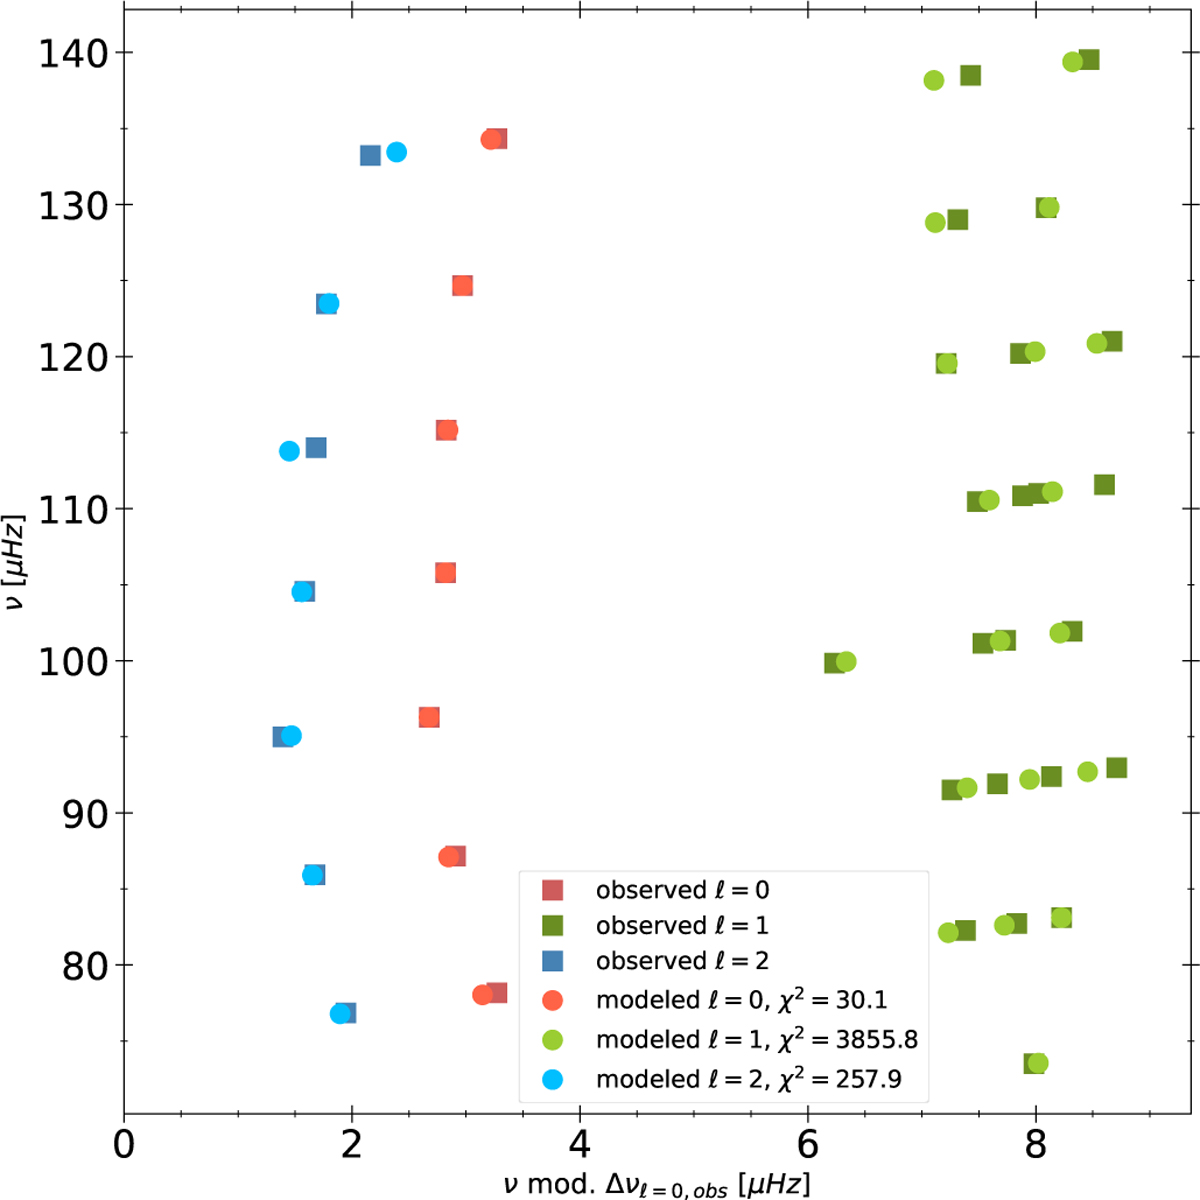
Echelle diagram of Kepler 91 comparing observed oscillation frequencies (listed in Table A.1) represented as squared points and theoretical oscillation frequencies represented as circle points. The whole modelled oscillation spectrum for the ℓ = 1 modes is included with shaded points. The difference between observed and modelled data is quantified, in the legend, as a χ2 for each spherical order ℓ. Finally, the error bars on the observed frequencies are included in the data points and not clearly distinguishable here.
Current usage metrics show cumulative count of Article Views (full-text article views including HTML views, PDF and ePub downloads, according to the available data) and Abstracts Views on Vision4Press platform.
Data correspond to usage on the plateform after 2015. The current usage metrics is available 48-96 hours after online publication and is updated daily on week days.
Initial download of the metrics may take a while.