Fig. 7
Download original image
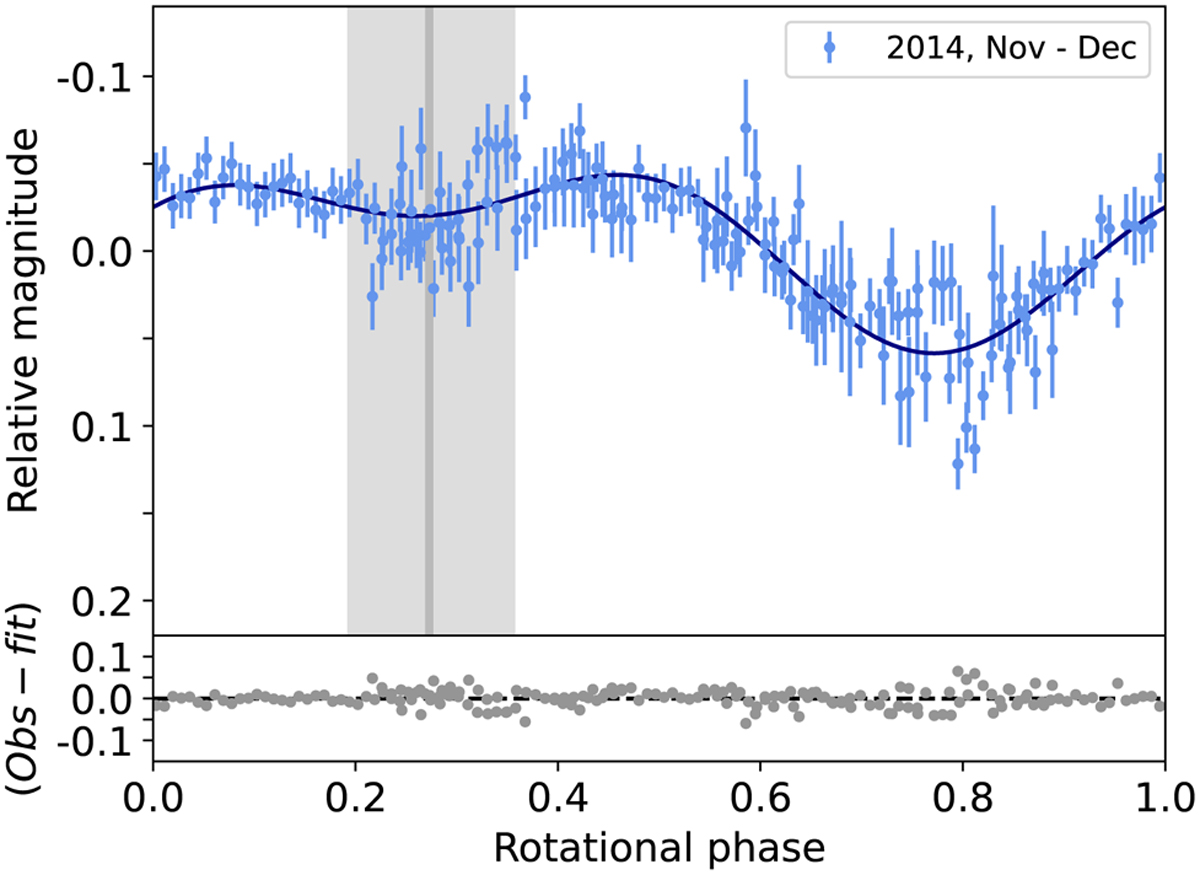
Bienor’s rotational light curve taken in 2014. The data was folded using a rotation period of 9.1719 ± 0.0002 h, being the zero rotational phase at the moment of the stellar occultation. Light blue dots represent observation data and the dark blue line represents a second-order Fourier-function fit, with an amplitude of 0.088 ± 0.007 mag. The gray vertical line indicates the rotational phase of the two Herschel measurements, with the gray shadowed region representing the error. At the bottom panel, gray dots represent the residual of the fit to the observational data. (Adapted from Fernández-Valenzuela et al. 2017.)
Current usage metrics show cumulative count of Article Views (full-text article views including HTML views, PDF and ePub downloads, according to the available data) and Abstracts Views on Vision4Press platform.
Data correspond to usage on the plateform after 2015. The current usage metrics is available 48-96 hours after online publication and is updated daily on week days.
Initial download of the metrics may take a while.