Fig. 6
Download original image
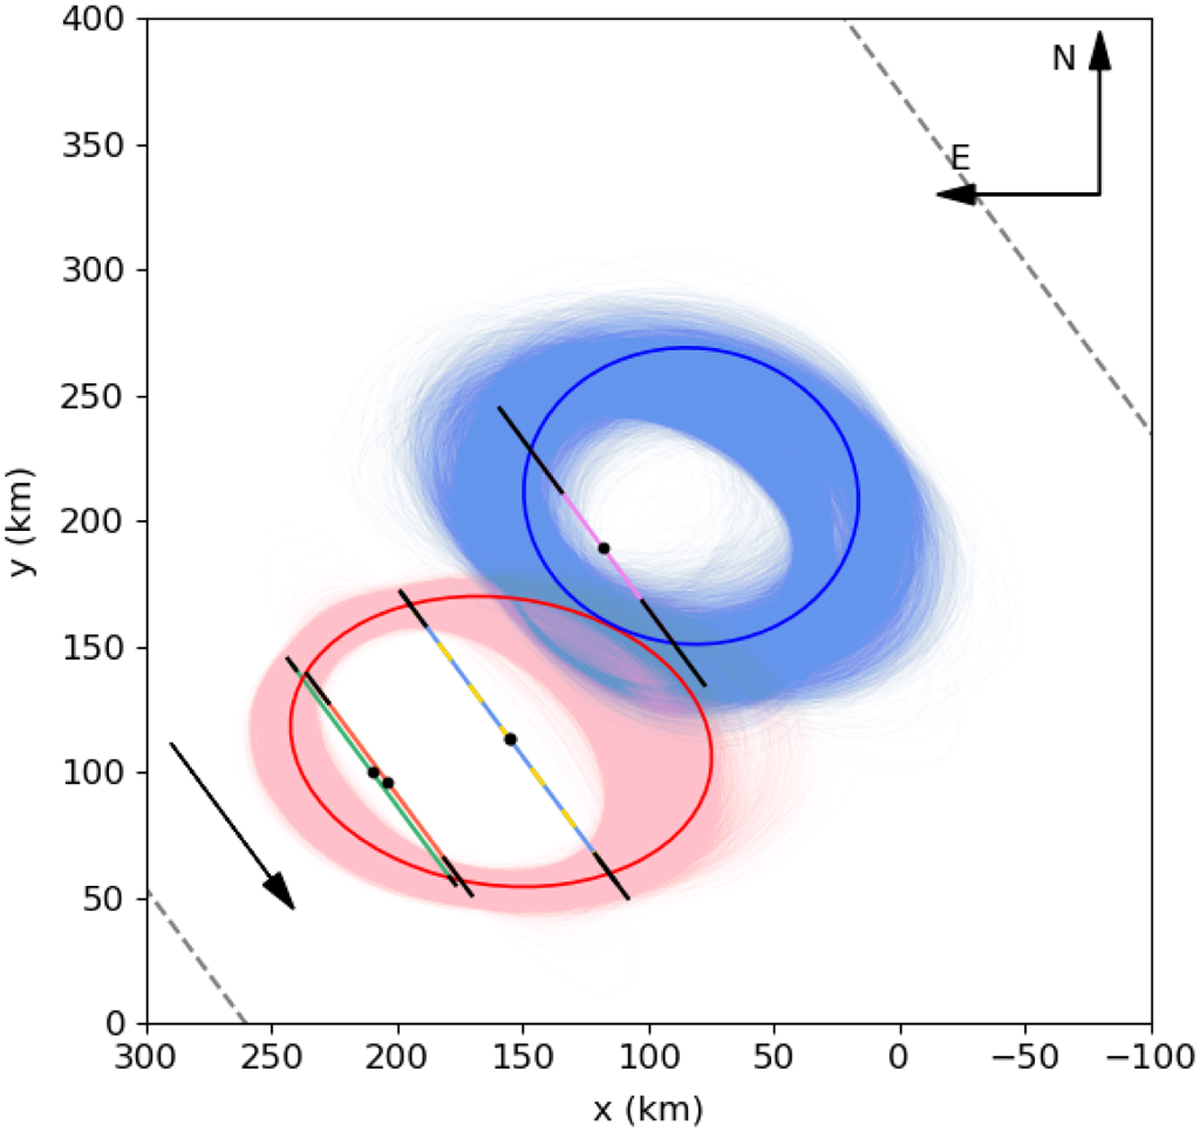
Simultaneous fit of two ellipses to the five chords from the light curves in Fig. 2 where x and y depict the difference between the JPL orbit and the center of the shadow. (No shift to the chords has been applied other than Manzanares’ due to the error in the computer synchronization). The blue and red ellipses represent the best fit in terms of minimization of a χ2 function, with the blue and red shadowed regions representing all 10 000 possible solutions given by the Monte Carlo method. For reference, the colours of the chords match those of Fig. 2, with the black solid lines in the extremities representing the 1-σ uncertainties of the ingress/egress times. We note that La Hita T40’s and T77’s chords are overlapping one another. Gray dashed lines outside the ellipses represent the closest locations (to the North and South of the object) where the stellar occultation was not detected, which correspond to the data from Agrupación Astron’omica de Sabadell (Sabadell) and La Sagra (Granada). The black arrow at the left-bottom corner depicts the shadow motion.
Current usage metrics show cumulative count of Article Views (full-text article views including HTML views, PDF and ePub downloads, according to the available data) and Abstracts Views on Vision4Press platform.
Data correspond to usage on the plateform after 2015. The current usage metrics is available 48-96 hours after online publication and is updated daily on week days.
Initial download of the metrics may take a while.