Fig. 5
Download original image
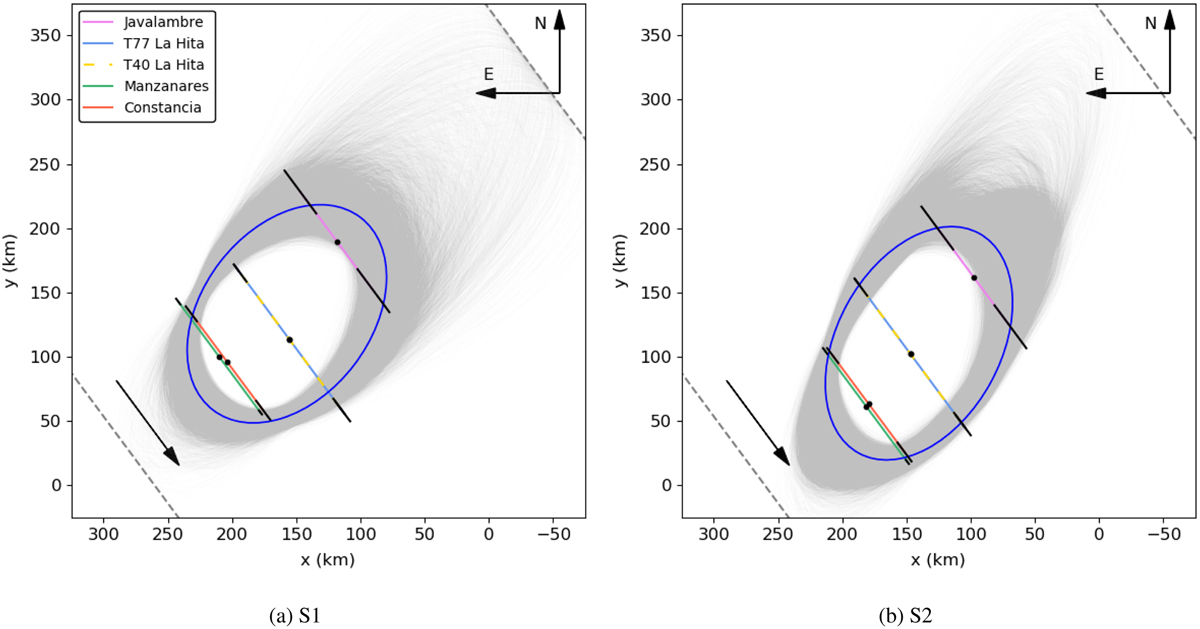
Elliptical fit to the five occultation chords obtained from the light curves shown in Fig. 2, where x and y depict the distances in the sky plane in the East-West and North-South directions respectively. The gray shadowed region represents the 10 000 ellipses given by the Monte Carlo method, with the blue ellipses representing the best fit to the extremities of the chords by least-squares minimization of the geometric distances. For reference, the colours of the chords match those of Fig. 2, with the black solid lines in the extremities representing the 1-σ uncertainties of the ingress/egress times. We note that La Hita T40’s and T77’s chords are overlapping one another. Gray dashed lines outside the ellipse represent the closest locations (to the North and South of the object) where the stellar occultation was not detected, which correspond to the data from Agrupación Astronómica de Sabadell (Sabadell) and La Sagra (Granada). Black arrows at the left-bottom corner indicate the star’s motion relative to the centaur. (a) Manzanares’s chord is displaced to match Constacia’s ingress (S1 fit). (b) All chords’ centers are aligned (S2 fit).
Current usage metrics show cumulative count of Article Views (full-text article views including HTML views, PDF and ePub downloads, according to the available data) and Abstracts Views on Vision4Press platform.
Data correspond to usage on the plateform after 2015. The current usage metrics is available 48-96 hours after online publication and is updated daily on week days.
Initial download of the metrics may take a while.