Fig. 4
Download original image
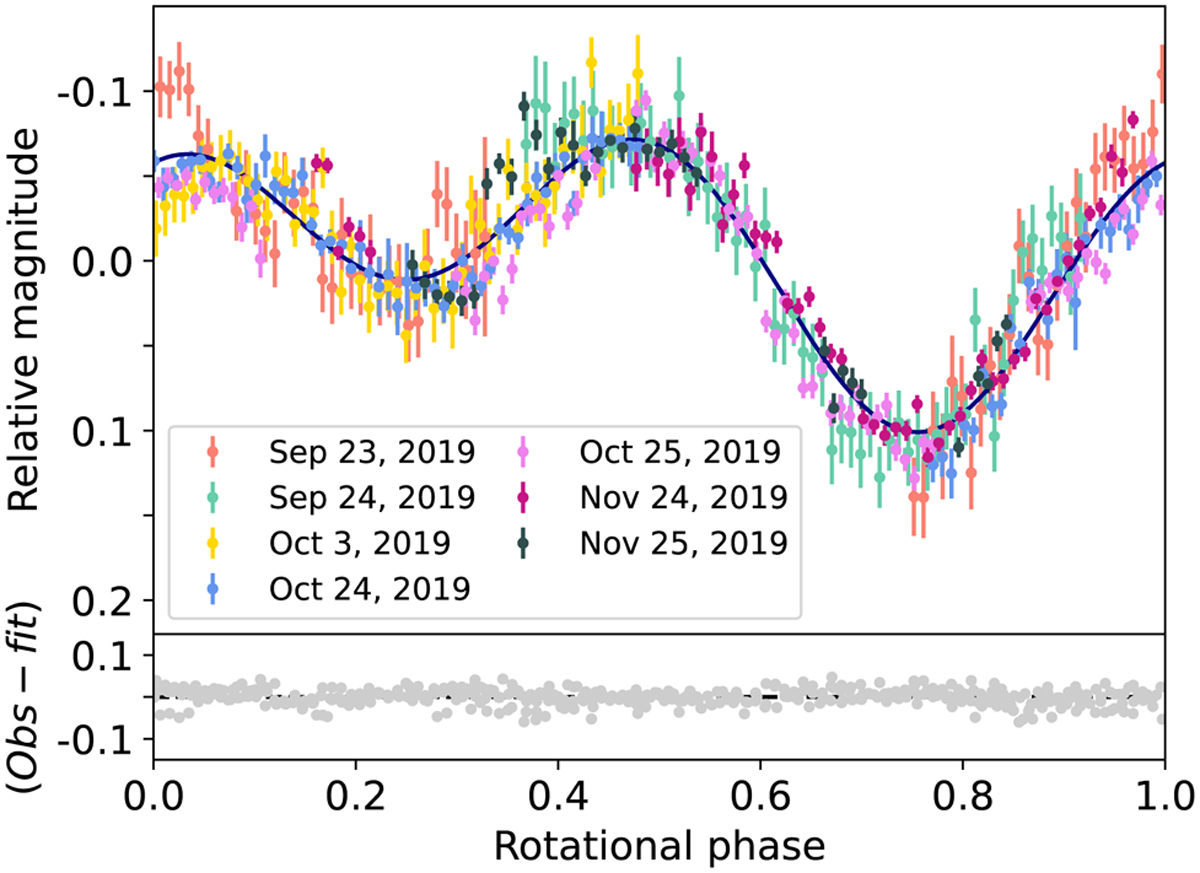
Bienor’s rotational light curve was obtained using data from the 1.23-m and 1.5-m telescopes (see Sect. 5 for a detailed explanation on the telescopes used here). The data were folded using a rotational period of 9.1719 ± 0.0002 h, being the zero rotational phase at the time of the occultation. Different colours represent different observation nights as described by the legend. The blue line represents a second-order Fourier-function fit to the observational data, the peak-to-valley amplitude of the fit has a value of 0.172 ± 0.003 mag. At the bottom panel, gray dots represent the residual of the fit to the observational data, with a standard deviation of 0.02 mag.
Current usage metrics show cumulative count of Article Views (full-text article views including HTML views, PDF and ePub downloads, according to the available data) and Abstracts Views on Vision4Press platform.
Data correspond to usage on the plateform after 2015. The current usage metrics is available 48-96 hours after online publication and is updated daily on week days.
Initial download of the metrics may take a while.