Fig. 3
Download original image
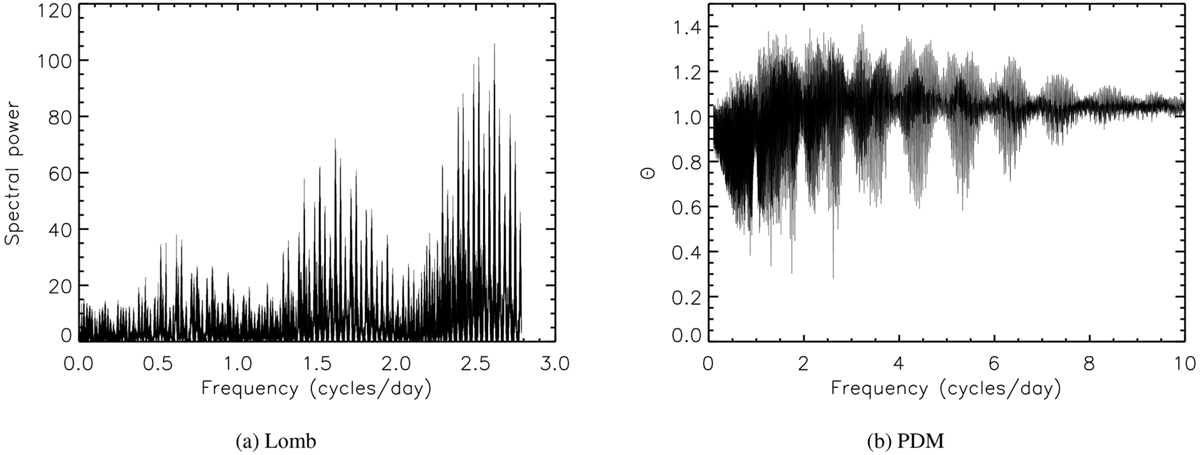
(a) Lomb periodogram spectral power derived from 2014, 2015, and 2019 photometric data. The spectral power is plotted as a function of the frequency (cycles per day). The maximum spectral power of 106 is at 2.61670 cycles per day, which corresponds to a rotation period of 9.1718 h. (b) PDM plot derived from 2014, 2015, and 2019 photometric data. The minimum value of θ is given for a frequency of 2.61669 cycles per day (i.e., P = 9.17188 h).
Current usage metrics show cumulative count of Article Views (full-text article views including HTML views, PDF and ePub downloads, according to the available data) and Abstracts Views on Vision4Press platform.
Data correspond to usage on the plateform after 2015. The current usage metrics is available 48-96 hours after online publication and is updated daily on week days.
Initial download of the metrics may take a while.