Fig. 2
Download original image
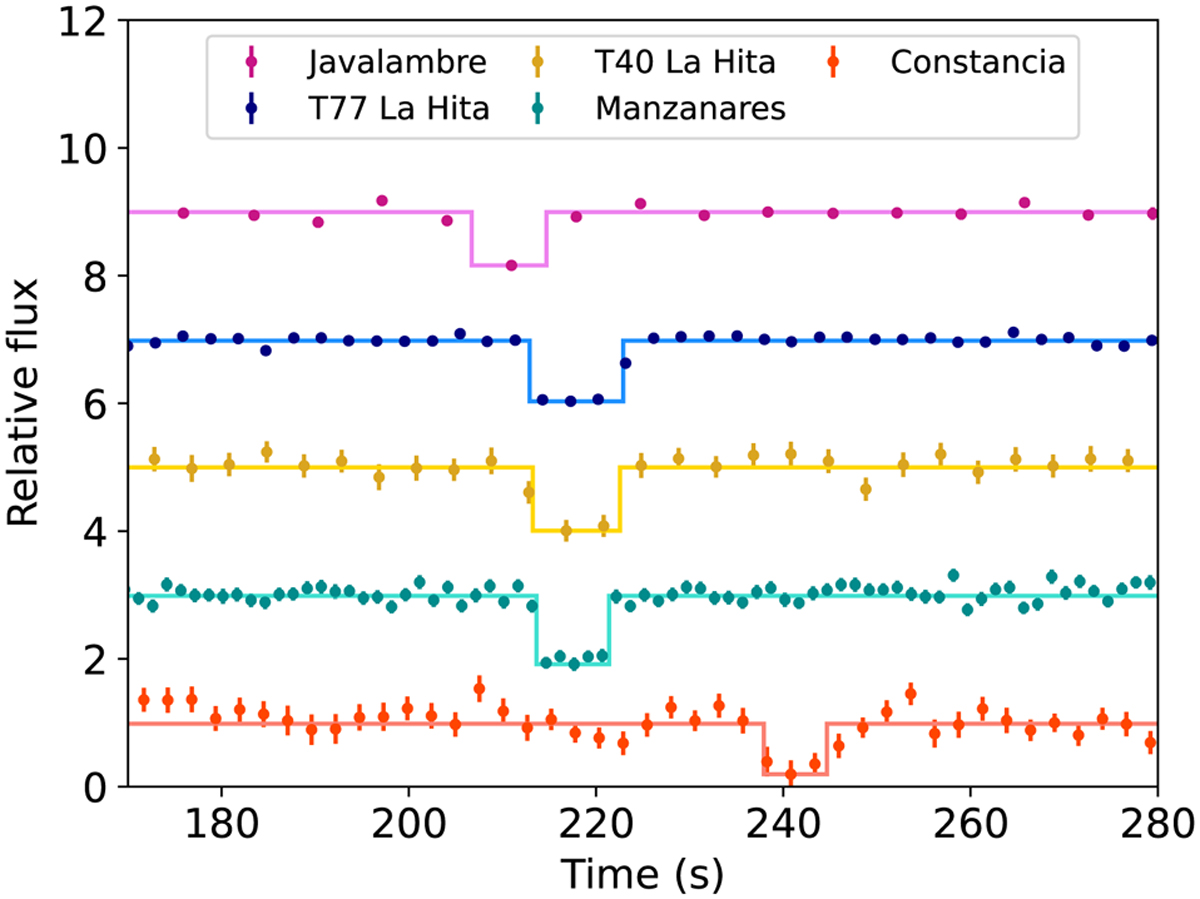
Occultation light curves with positive detections obtained from different telescopes distributed along the shadow path. colour points represent observational data with their uncertainties, while the lines represent a square-well fit to the observational data. Time is given in seconds after 2019 January 11 01:00:00 UT. Light curves have been normalized to one outside the occultation drop and shifted by an arbitrary offset in this plot for clarity.
Current usage metrics show cumulative count of Article Views (full-text article views including HTML views, PDF and ePub downloads, according to the available data) and Abstracts Views on Vision4Press platform.
Data correspond to usage on the plateform after 2015. The current usage metrics is available 48-96 hours after online publication and is updated daily on week days.
Initial download of the metrics may take a while.