Fig. A.4
Download original image
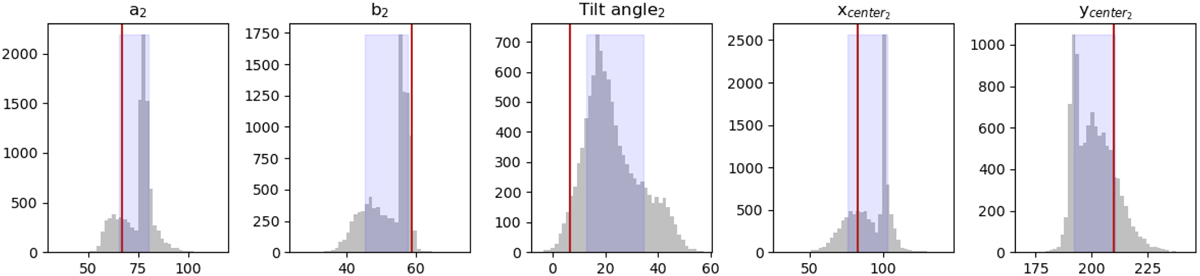
Monte Carlo distributions for S3, ellipse 2, of the semi-axes a and b (in km), the tilt angle (in degrees) and the coordinates (x, y) of the center of the ellipse. The vertical red lines show the value of the parameters for the best elliptical fit via least-squares minimization, and the blue shaded area delimits the 67% confidence interval, see Table 4.
Current usage metrics show cumulative count of Article Views (full-text article views including HTML views, PDF and ePub downloads, according to the available data) and Abstracts Views on Vision4Press platform.
Data correspond to usage on the plateform after 2015. The current usage metrics is available 48-96 hours after online publication and is updated daily on week days.
Initial download of the metrics may take a while.