Fig. 1
Download original image
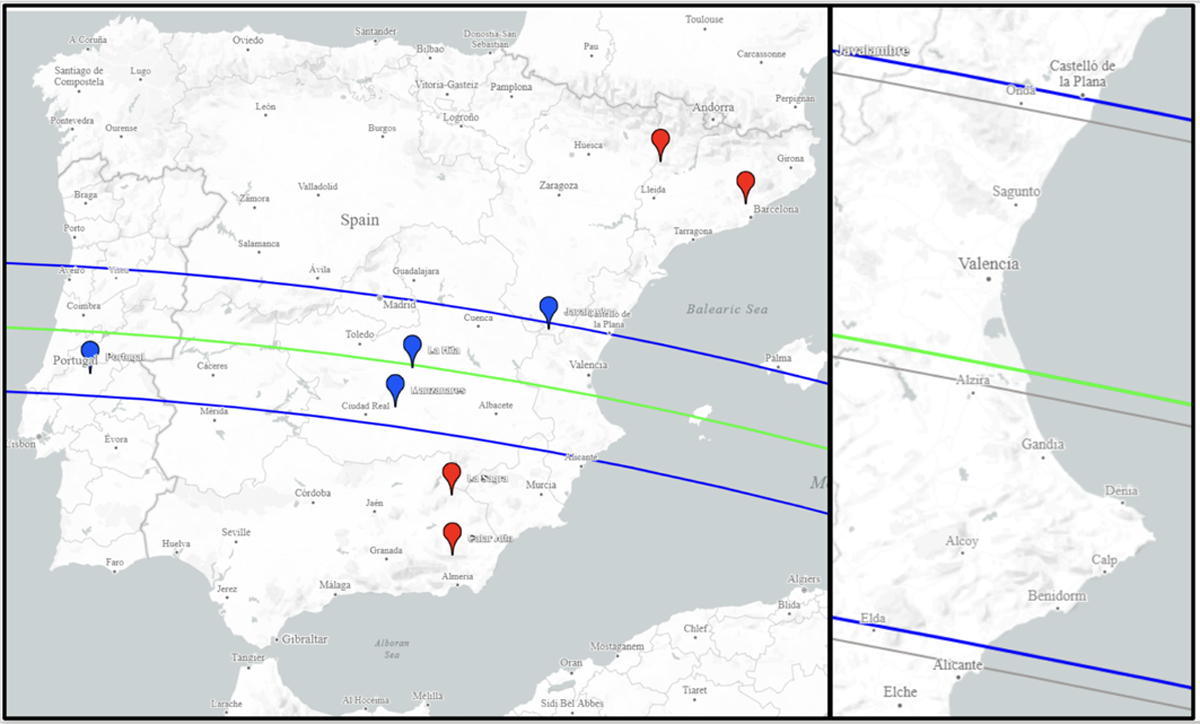
Map representing the post-occultation shadow path (blue lines) of the stellar occultation produced by Bienor on 11th January 2019 (with the green line representing the center of the shadow). The width of the shadow path on the map is that from the fitted parameters of S1 scenario (see Sect. 6). The motion of the shadow is from East to West. Blue and red tags show the location of the observatories in Table 2, with blue meaning positive detection and red meaning negative detection. At the right it can be seen a zoom of the Spanish East coast displaying the difference between the predicted (gray lines) and the post-occultation shadow path (with the same colour code as in the left panel), which results into 10 mas.
Current usage metrics show cumulative count of Article Views (full-text article views including HTML views, PDF and ePub downloads, according to the available data) and Abstracts Views on Vision4Press platform.
Data correspond to usage on the plateform after 2015. The current usage metrics is available 48-96 hours after online publication and is updated daily on week days.
Initial download of the metrics may take a while.