Fig. 6.
Download original image
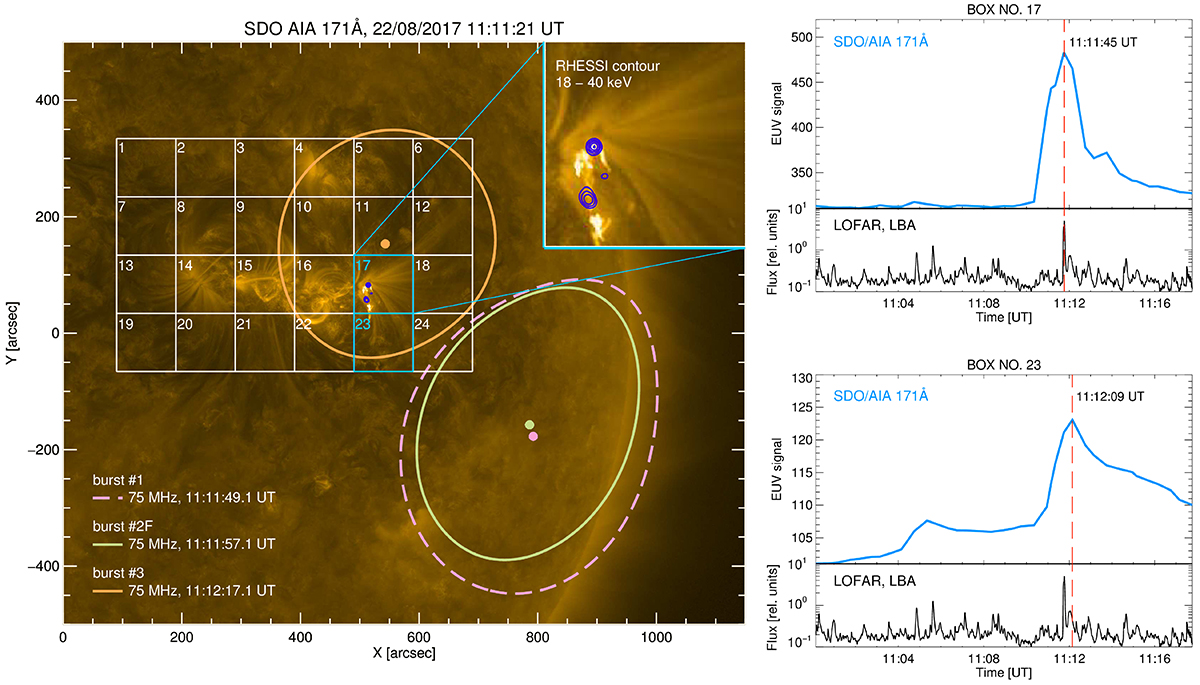
Map from SDO of the analyzed active region, and obtained signals from LOFAR and SDO. The left panel shows the active region AR 12671 during the solar flare registered in AIA 171 Å by SDO with a superimposed grid and the radio contours at 75 MHz from the radio bursts #1, #2, and #3. In the right upper corner of the figure there is a magnification of box 17 with non-thermal hard X-ray footpoints (dark blue contour) in the 18–40 keV range, as derived from RHESSI observations. The right panels show EUV signals from boxes 17 and 23 and their comparison with LOFAR total radio flux. The maxima of the EUV signal are indicated by the red dotted lines.
Current usage metrics show cumulative count of Article Views (full-text article views including HTML views, PDF and ePub downloads, according to the available data) and Abstracts Views on Vision4Press platform.
Data correspond to usage on the plateform after 2015. The current usage metrics is available 48-96 hours after online publication and is updated daily on week days.
Initial download of the metrics may take a while.