Fig. 5.
Download original image
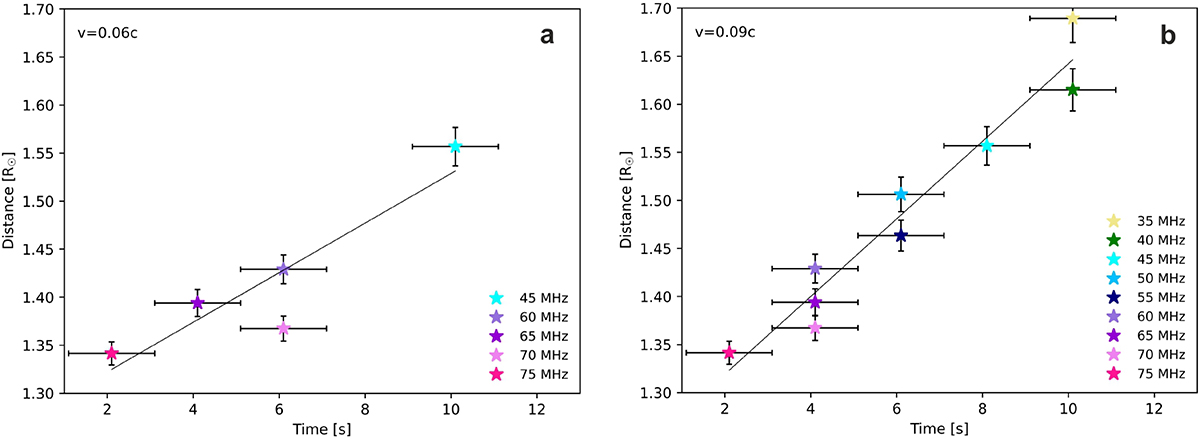
Radial motion of bursts #2 (left panel) and #3 (right panel) obtained from centroids. The colors correspond to different frequencies from 35 to 75 MHz. The velocities were calculated from the slopes of the fits and are given in the upper left corners. The vertical error bars in the two plots represent the extent of the FWHM of the beams, which varies with frequency. The horizontal error bars are due to averaging the data in time steps of 1 s.
Current usage metrics show cumulative count of Article Views (full-text article views including HTML views, PDF and ePub downloads, according to the available data) and Abstracts Views on Vision4Press platform.
Data correspond to usage on the plateform after 2015. The current usage metrics is available 48-96 hours after online publication and is updated daily on week days.
Initial download of the metrics may take a while.