Fig. 2.
Download original image
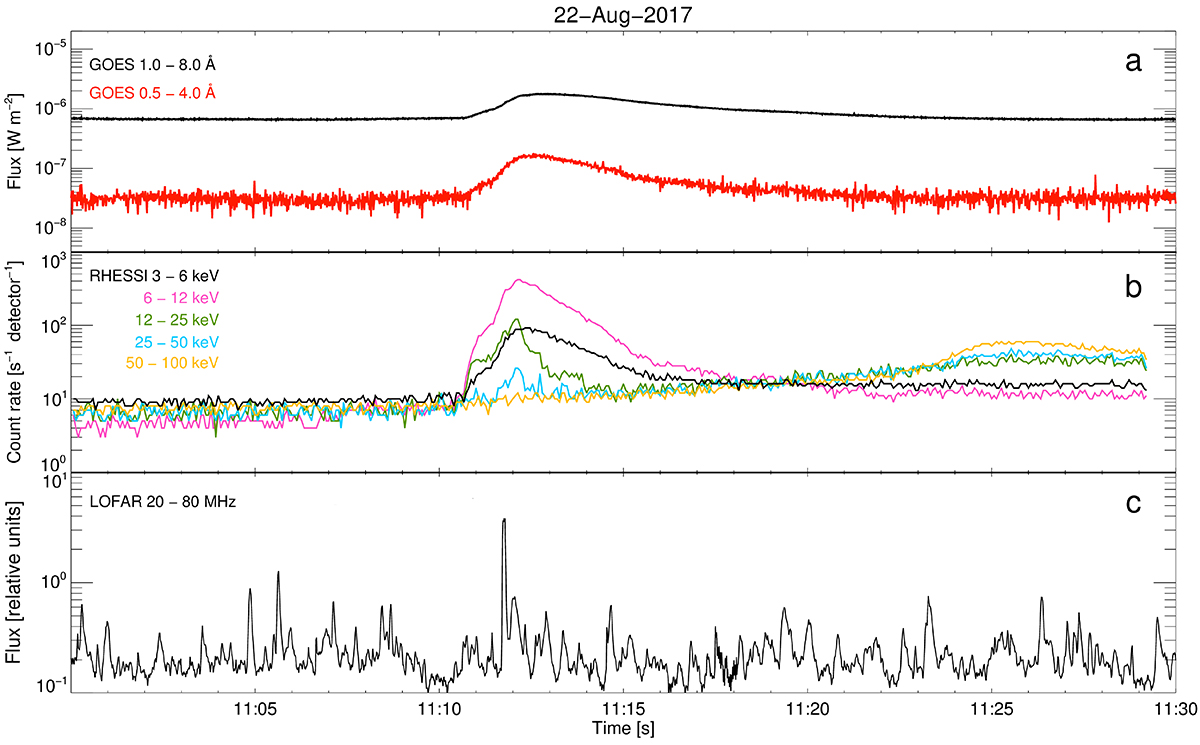
Comparison of radio flux with X-ray signals from GOES and RHESSI of the radio event observed on 22 August 2017. Panel (a) shows GOES fluxes, including a C1.0 solar flare with a peak at 11:13 UT. Panel (b) shows the RHESSI count rates in five wide energy bins. Panel (c) presents the radio total power flux from LOFAR 20–80 MHz (LBA) band with a single strong peak at 11:11:46 UT.
Current usage metrics show cumulative count of Article Views (full-text article views including HTML views, PDF and ePub downloads, according to the available data) and Abstracts Views on Vision4Press platform.
Data correspond to usage on the plateform after 2015. The current usage metrics is available 48-96 hours after online publication and is updated daily on week days.
Initial download of the metrics may take a while.