Fig. 5
Download original image
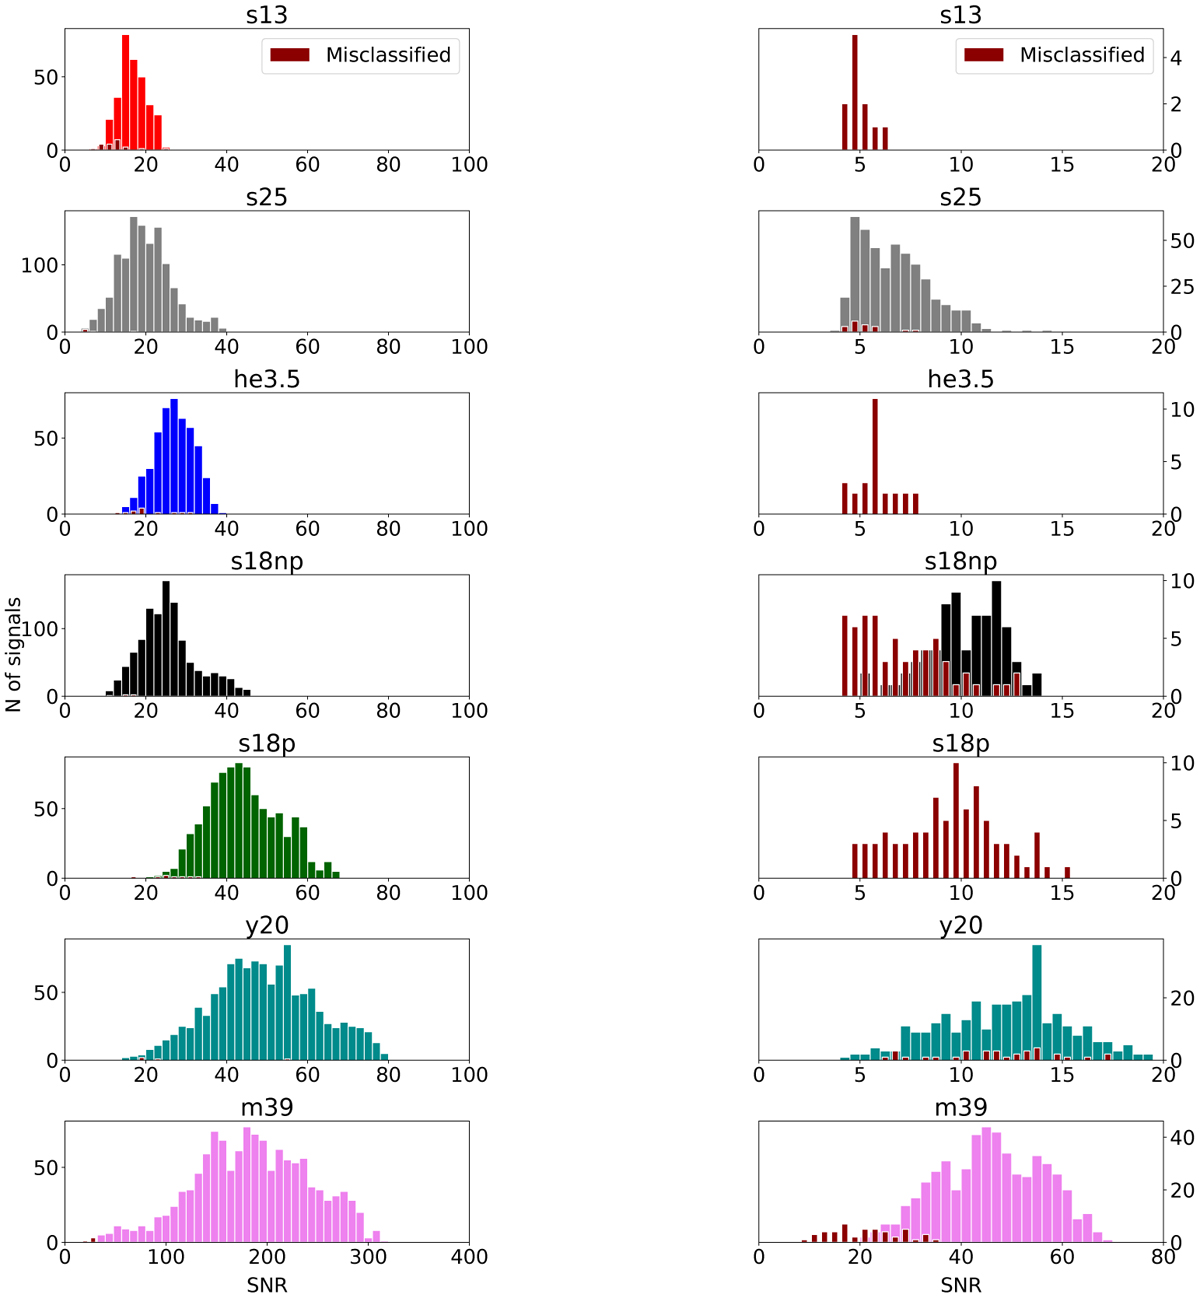
Histograms for matched filter S/N distribution of the LIGO L1, H1 (left), and Virgo V1 (right) test sets. The dark red thinner bars represent the number of signals misclassified by the merged LSTM and CNN model at each S/N interval. The bin widths are 2 for L1, H1 and 0.5 for V1, with the exception of m39 which has a larger S/N range. For the latter model the binning is equal to 8 for L1, H1 and 2 for V1.
Current usage metrics show cumulative count of Article Views (full-text article views including HTML views, PDF and ePub downloads, according to the available data) and Abstracts Views on Vision4Press platform.
Data correspond to usage on the plateform after 2015. The current usage metrics is available 48-96 hours after online publication and is updated daily on week days.
Initial download of the metrics may take a while.