Fig. C.5
Download original image
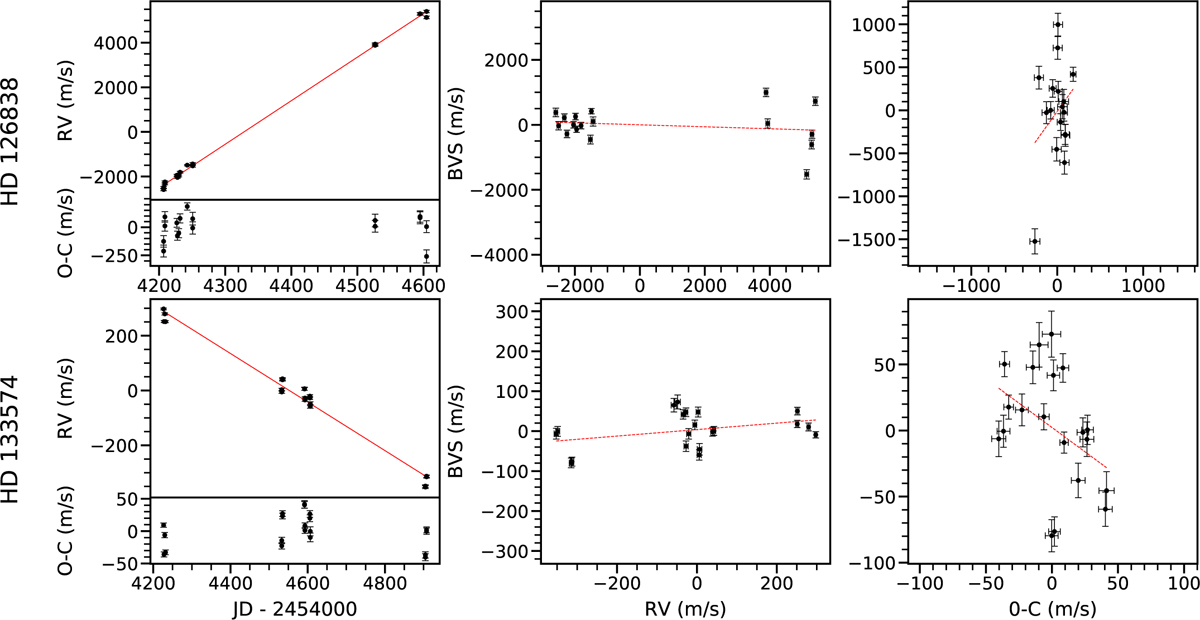
Stars with RV trend for which a linear regression was performed. First column: top: RV time variations (black) with the model of its linear regression (red line). Bottom: Residuals of the linear regression. Second column: BVS vs. RV diagram (black) and its best linear model (dashed red line). Third column: BVS vs. RV residuals diagram and its best linear model (dashed red line).
Current usage metrics show cumulative count of Article Views (full-text article views including HTML views, PDF and ePub downloads, according to the available data) and Abstracts Views on Vision4Press platform.
Data correspond to usage on the plateform after 2015. The current usage metrics is available 48-96 hours after online publication and is updated daily on week days.
Initial download of the metrics may take a while.