Fig. 4.
Download original image
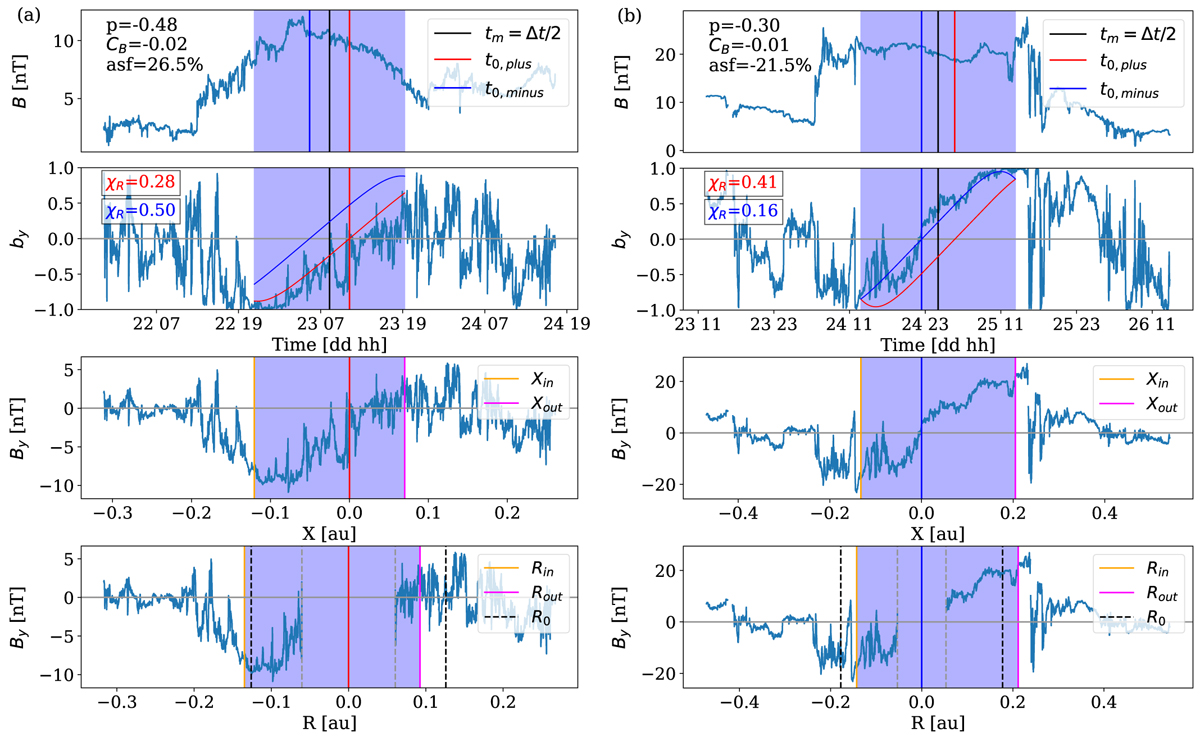
Definition of the asf sign and the in- and outbound regions of the MC in X and R spacial coordinates. From top to bottom, the first two rows show the magnetic field magnitude B and the By component in function of time. The By profile is dominating in χR (Eq. (8)) to determine the sign of the asf. The third and fourth rows show the in- and outbound regions of the MC in X and R spacial coordinates, respectively. Column a corresponds to an MC observed on 22 August 1995 as an example of an asf > 0 with Rin > R0 > Rout as the schema shown in Fig. 3a. Furthermore, in this case Rinf = Rout and Rsup = Rin. Column b corresponds to an MC observed on 24 July 2004 as an example of an asf < 0 with Rin < R0 < Rout as the schema shown in Fig. 3b. In this case, Rinf = Rin and Rsup = Rout.
Current usage metrics show cumulative count of Article Views (full-text article views including HTML views, PDF and ePub downloads, according to the available data) and Abstracts Views on Vision4Press platform.
Data correspond to usage on the plateform after 2015. The current usage metrics is available 48-96 hours after online publication and is updated daily on week days.
Initial download of the metrics may take a while.