Fig. 3.
Download original image
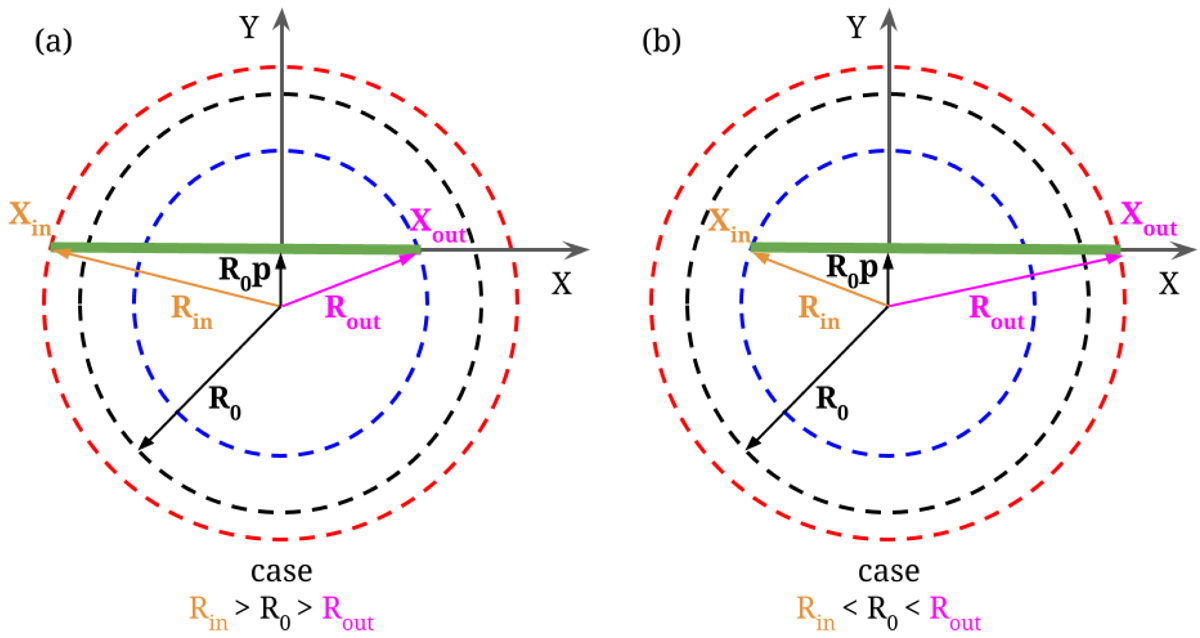
Schema of an MC cross-section used to define the MC parameters defined by Démoulin et al. (2019). The MC interval, deduced from in situ observations, is schematised with a thick green line. The dashed circles represent the boundary for three characteristic FRs: in blue for the in situ FR, in black for the fitted Lundquist FR limited within Bz(R0)=0, and in red for the expected fully formed FR without erosion at its boundary. Two cases are shown: (a) Rin > R0 > Rout and (b) Rin < R0 < Rout corresponding to the MC examples shown in Fig. 4.
Current usage metrics show cumulative count of Article Views (full-text article views including HTML views, PDF and ePub downloads, according to the available data) and Abstracts Views on Vision4Press platform.
Data correspond to usage on the plateform after 2015. The current usage metrics is available 48-96 hours after online publication and is updated daily on week days.
Initial download of the metrics may take a while.