Fig. 2.
Download original image
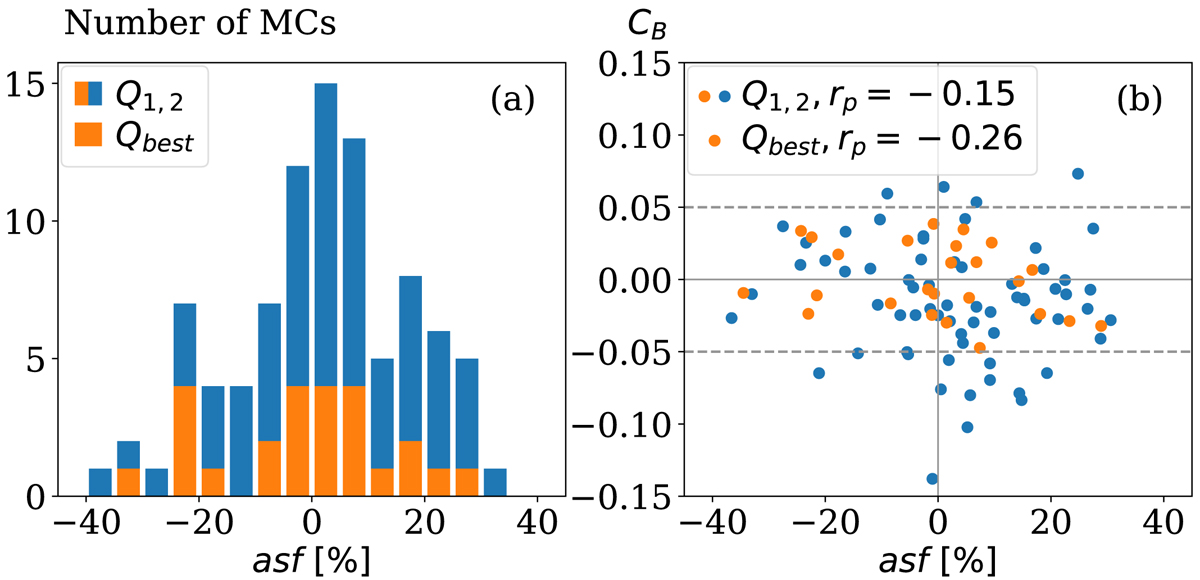
Signed asymmetry factor results. (a) Histogram of the signed asf (related to the time of the closest approach to the FR axis with Eq. (2)). (b) Scatter plot of asf vs. CB (related to the magnetic field profile symmetry). The group Q1, 2 of analysed MCs and its subset Qbest are shown. The dashed line in (b) corresponds to the most symmetric MCs with |CB|≤0.05.
Current usage metrics show cumulative count of Article Views (full-text article views including HTML views, PDF and ePub downloads, according to the available data) and Abstracts Views on Vision4Press platform.
Data correspond to usage on the plateform after 2015. The current usage metrics is available 48-96 hours after online publication and is updated daily on week days.
Initial download of the metrics may take a while.