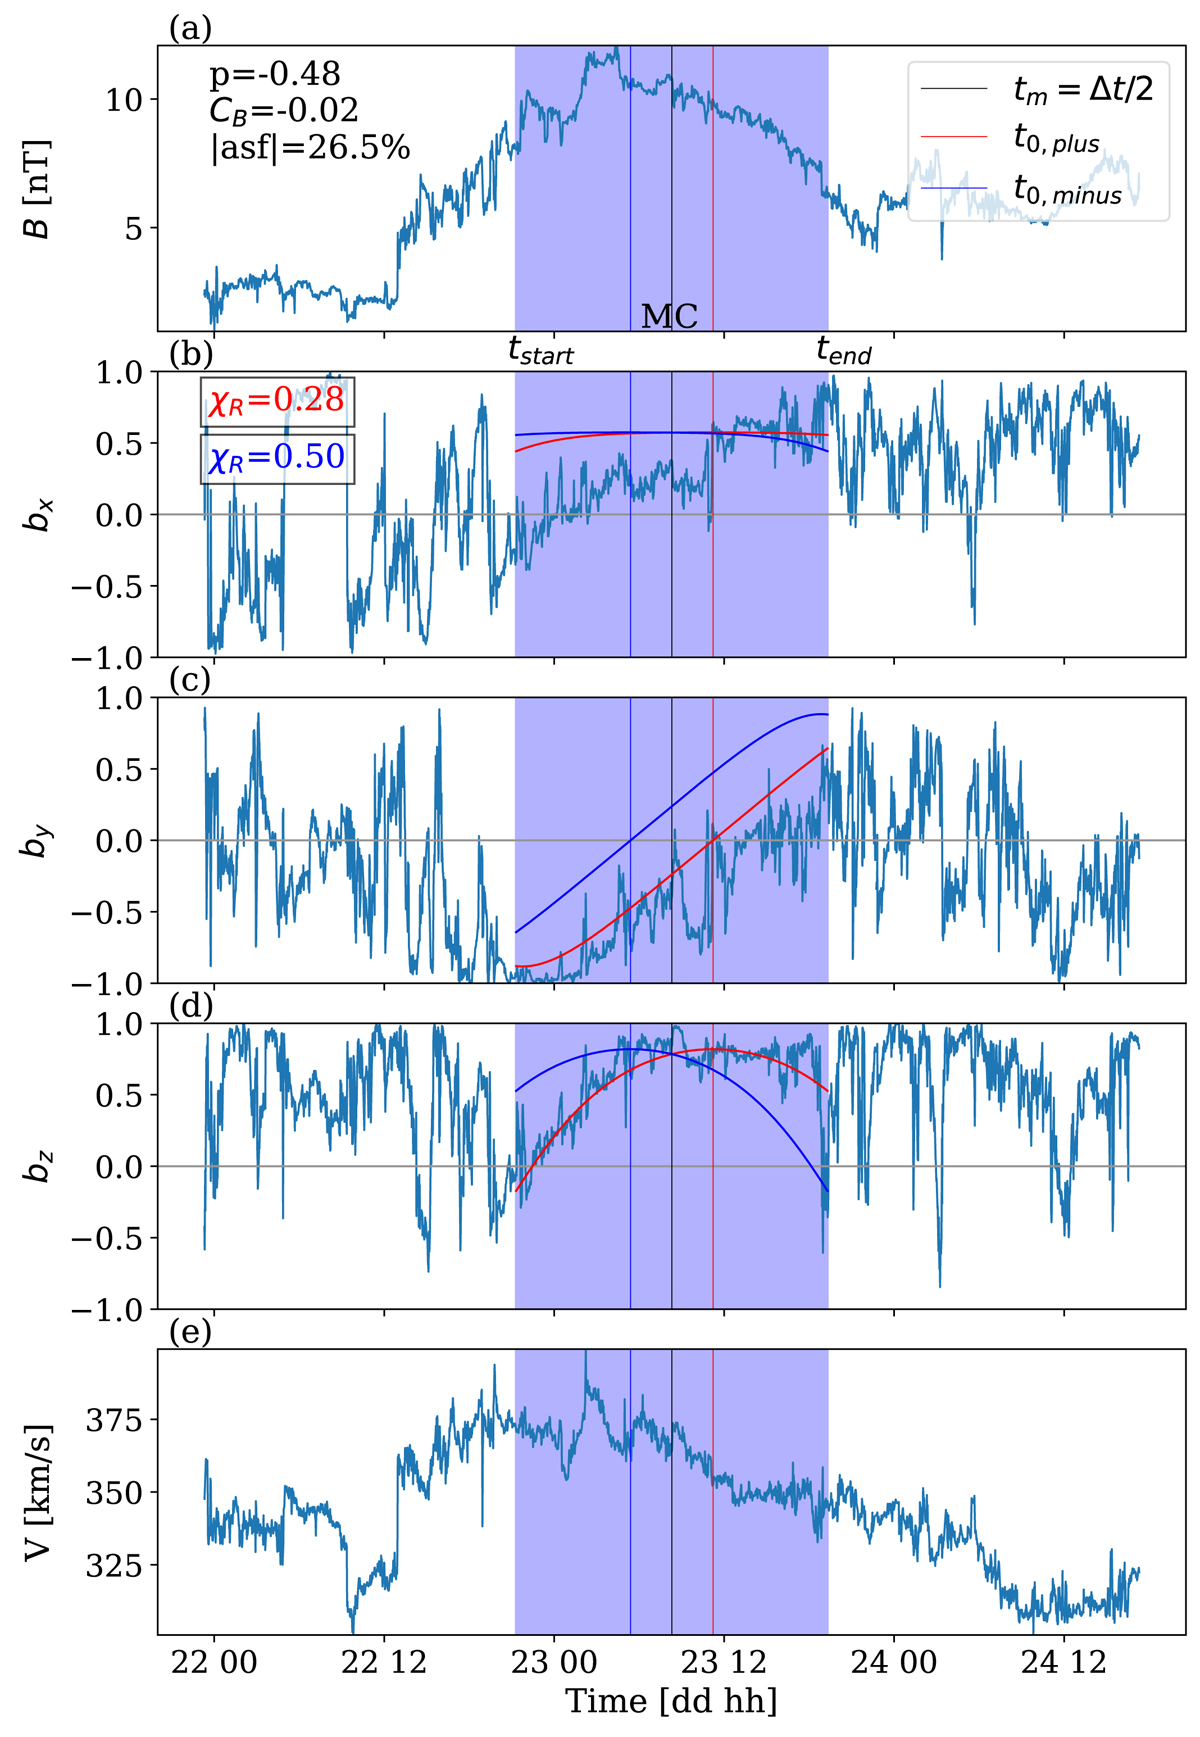
Fig. 1.
Download original image
Selection of the correct sign of the asf for the MC observed on 22 August 1995. The MC region is shown with a blue background. (a) The magnetic field magnitude. (b), (c), (d) The magnetic field components, normalised to the field magnitude, in the FR frame. Two Lundquist solutions fitted to the observed magnetic field components, with their origin set at t0, minus (blue) and t0, plus (red) is added in (b), (c), (d). (e) The observed velocity profile. The correct sign of the asf is determined by the best fit represented by the lower χR value (Eq. (8)). Here it is for sgn(asf)=1 (red curves).
Current usage metrics show cumulative count of Article Views (full-text article views including HTML views, PDF and ePub downloads, according to the available data) and Abstracts Views on Vision4Press platform.
Data correspond to usage on the plateform after 2015. The current usage metrics is available 48-96 hours after online publication and is updated daily on week days.
Initial download of the metrics may take a while.