Fig. 8
Download original image
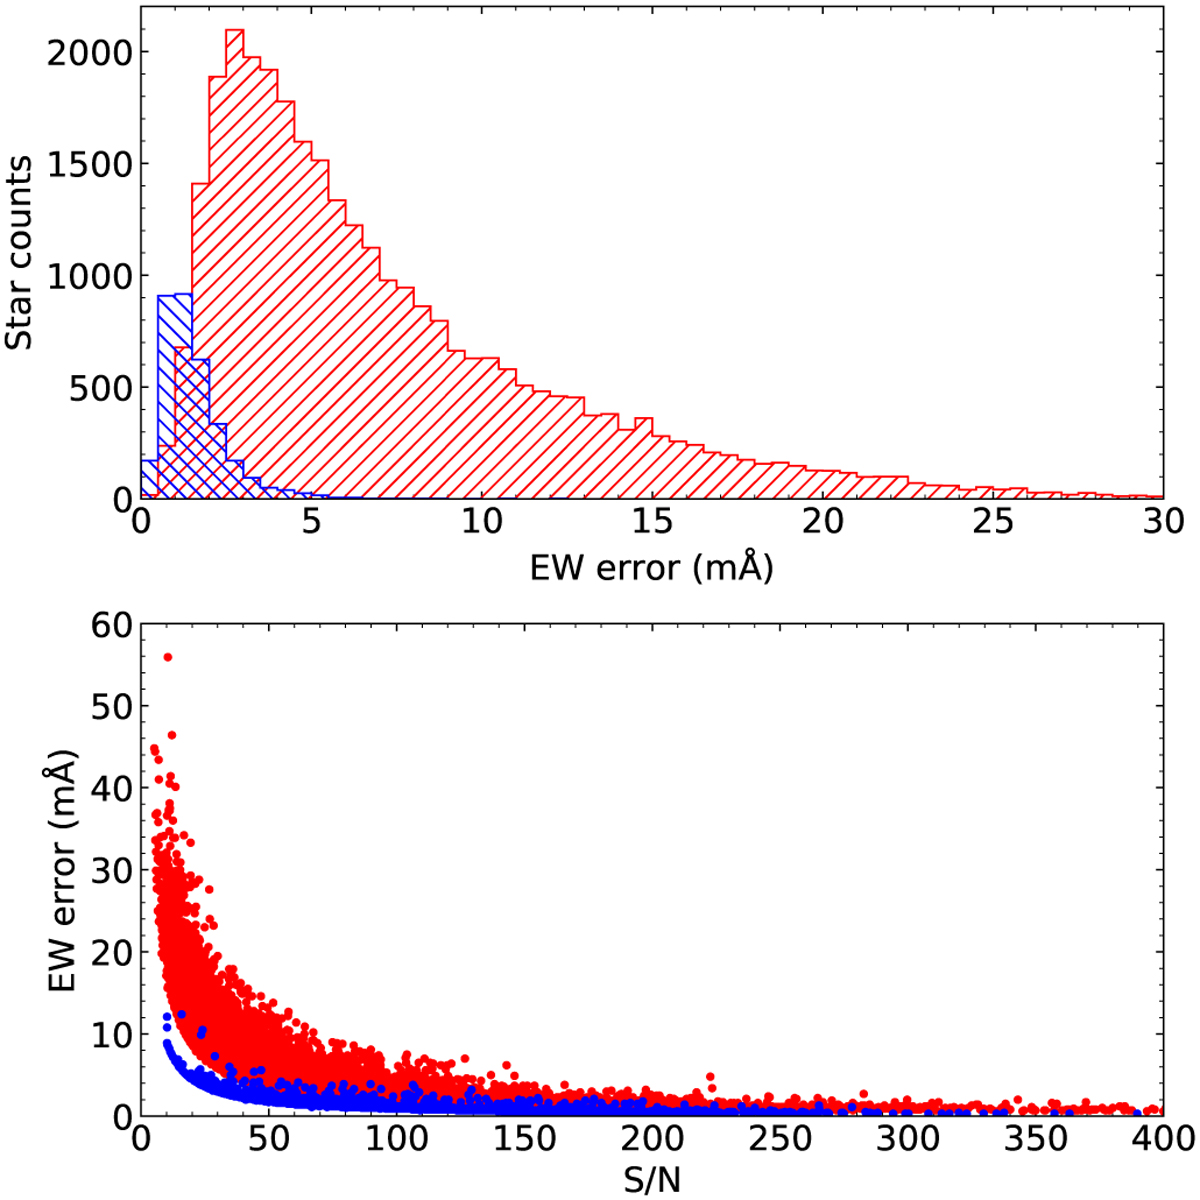
Uncertainties on EW or pEW. In the top panel, we show the distribution of the uncertainties for Giraffe (red hatched histogram) and UVES (blue hatched histogram). In the bottom panel, we plot the uncertainties on EW or pEW as a function of the S/N. Colours are the same as the top panel, and the plot was limited to S/N < 400 for better clarity. Uncertainties are higher for stars with higher rotational velocity.
Current usage metrics show cumulative count of Article Views (full-text article views including HTML views, PDF and ePub downloads, according to the available data) and Abstracts Views on Vision4Press platform.
Data correspond to usage on the plateform after 2015. The current usage metrics is available 48-96 hours after online publication and is updated daily on week days.
Initial download of the metrics may take a while.