Fig.6
Download original image
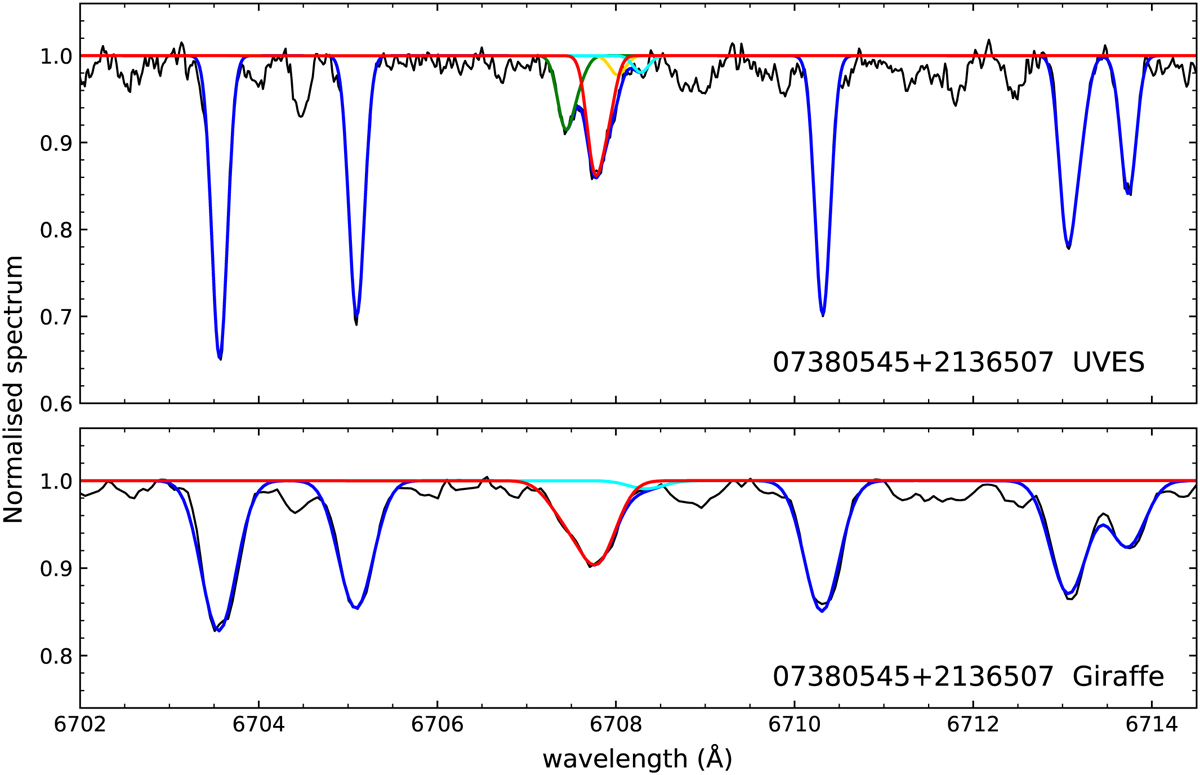
Best-fit results for the UVES (upper panel, S/N = 119) andGiraffe (lower panel, S /N = 223) spectra of the giant star 07380545+2136507 shown in Fig. 1 (Teff = 4899 ± 34 K, log g = 2.80 ± 0.05, [Fe/H] = −0.17 ± 0.05). In the upper panel, the red and green lines show the best-fit lithium and Fe blend components, respectively, while in the lower panel only the combined Li + Fe component is shown in red. The gold and cyan lines are the best-fit components at ~6708.0 and 6708.3 Å. The total fit including the additional lines (see text) is marked in blue. The measured EWs are EW(Li) = 40.0 ± 0.8 mÅ, EW(Fe) = 22.8 ± 0.8 mÅ for UVES, and EW(Li + Fe) = 64.6 ± 1.1 mÅ for Giraffe. The resulting lithium abundances are A (Li) = 1.25 ± 0.04 for UVES and 1.30 ± 0.05 for Giraffe.
Current usage metrics show cumulative count of Article Views (full-text article views including HTML views, PDF and ePub downloads, according to the available data) and Abstracts Views on Vision4Press platform.
Data correspond to usage on the plateform after 2015. The current usage metrics is available 48-96 hours after online publication and is updated daily on week days.
Initial download of the metrics may take a while.