Fig. 11
Download original image
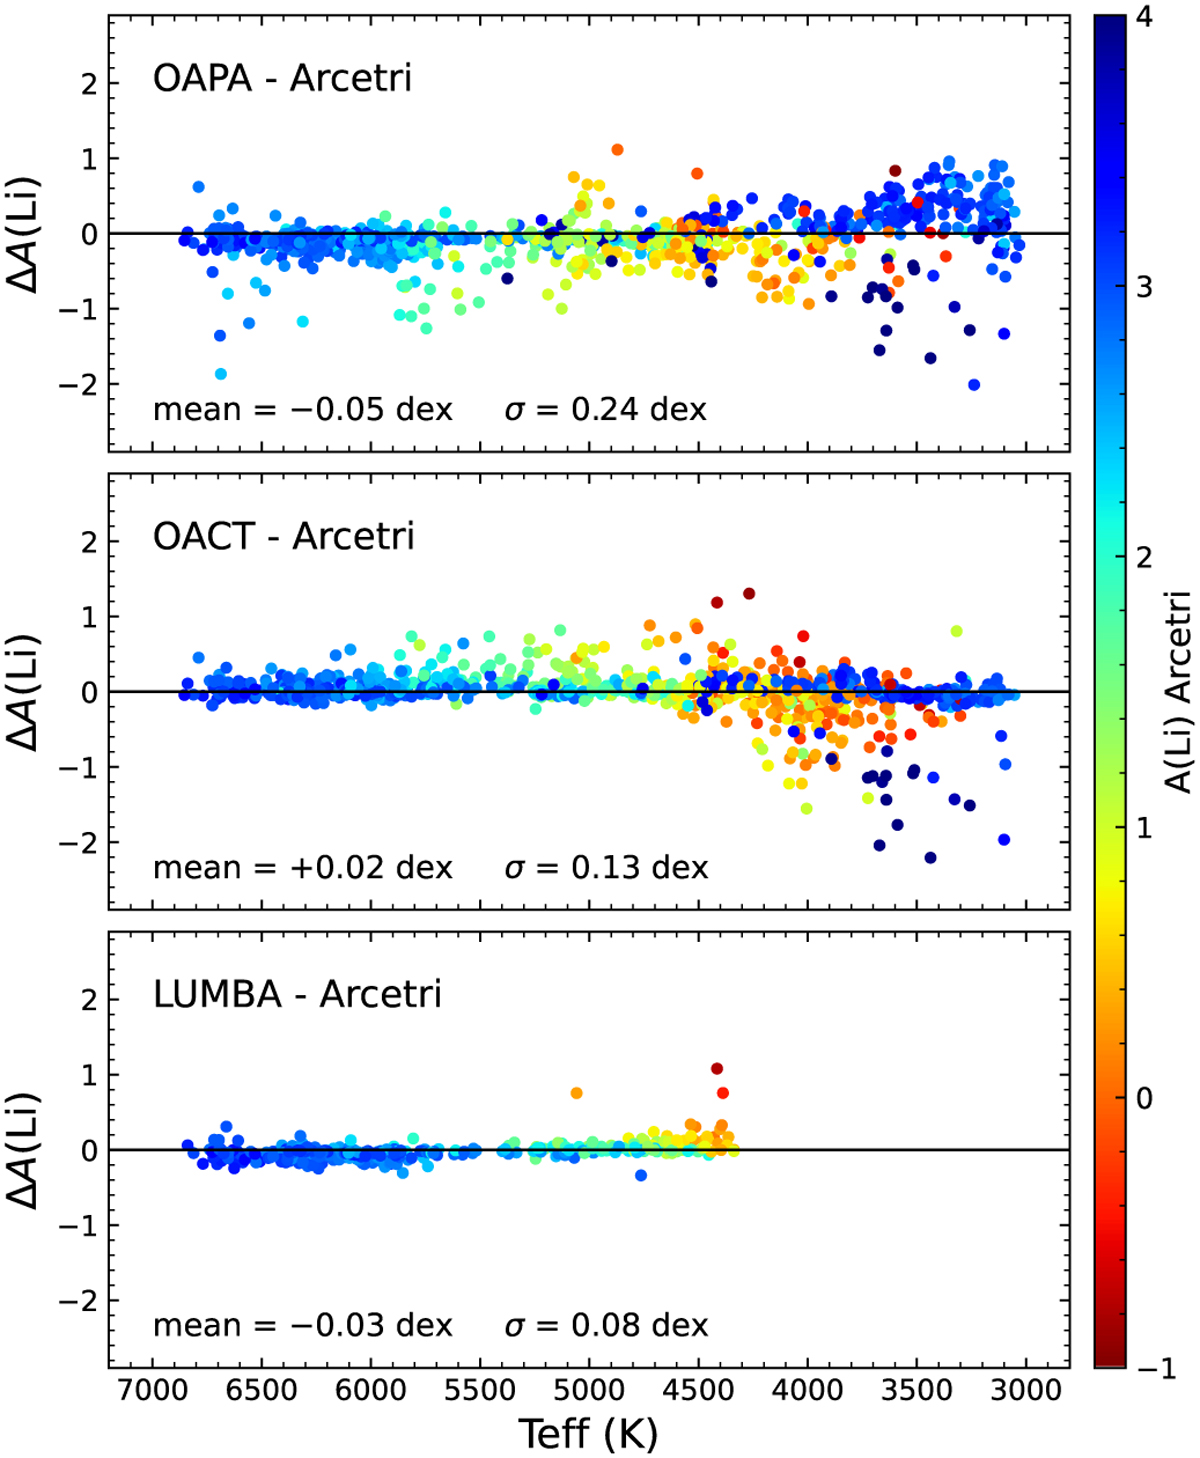
Comparison between the abundances derived by Arcetri with those derived by other nodes as a function of Teff, for stars observed with Giraffe. The plotted differences ∆A(Li) are computed as the other node minus Arcetri, and are colour-coded by the Arcetri abundance. Only stars with detections in both nodes are plotted. The 3-σ clipped average and standard deviation of the abundance differences are indicated in the respective panels.
Current usage metrics show cumulative count of Article Views (full-text article views including HTML views, PDF and ePub downloads, according to the available data) and Abstracts Views on Vision4Press platform.
Data correspond to usage on the plateform after 2015. The current usage metrics is available 48-96 hours after online publication and is updated daily on week days.
Initial download of the metrics may take a while.