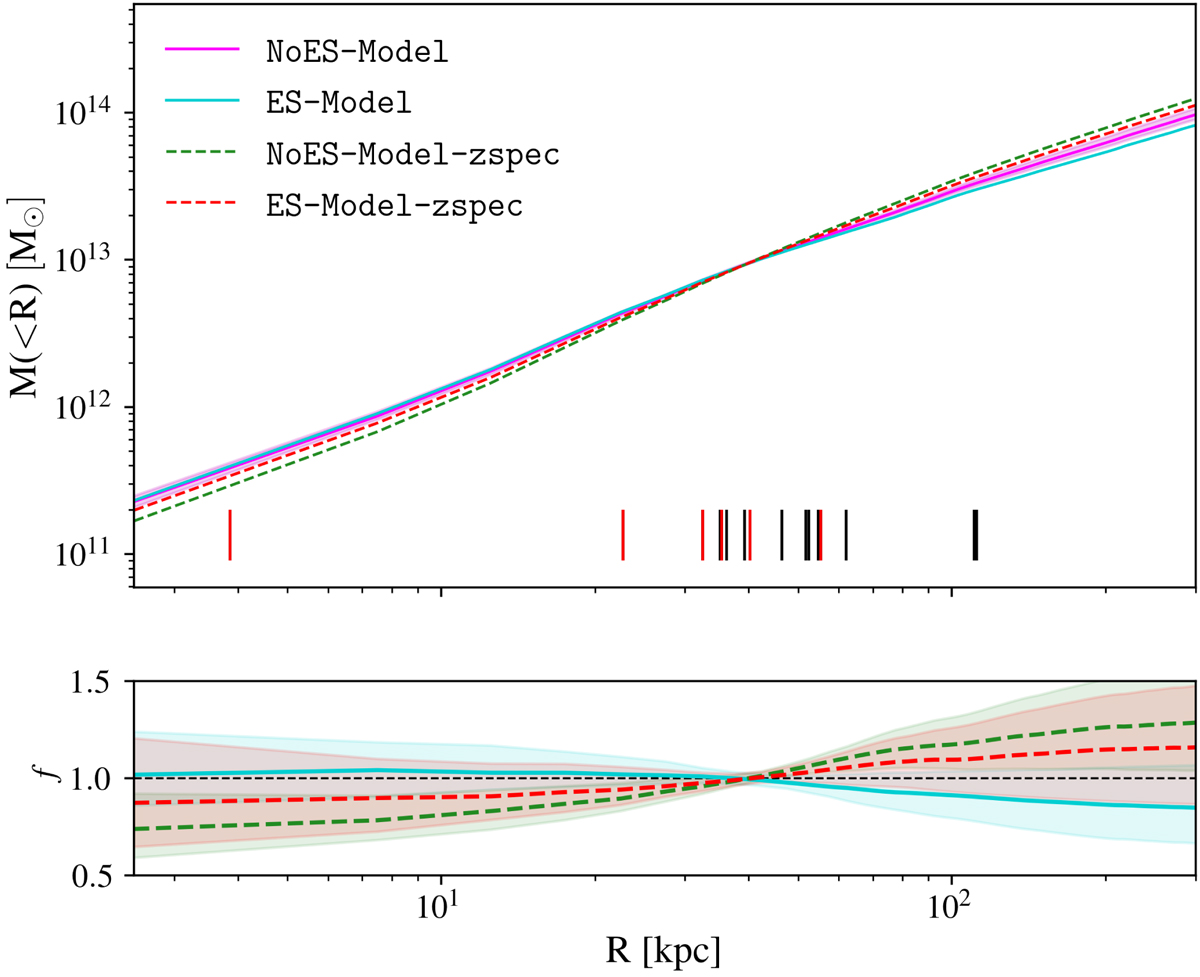
Fig. 6.
Download original image
Cumulative projected total mass profile of SDSS 2222 as a function of the distance from the BCG centre (ID 2010, marked as a black cross in Fig. 4). Top: the coloured lines show the median values of the total mass profile, and the shaded magenta area encompasses the 16th and the 84th percentiles, estimated from 500 random Bayesian Markov chain Monte Carlo realisations for the NoES-Model. The projected distances of the 18 multiple images from the BCG are indicated as vertical black lines. The distances of the six quasar images are highlighted in red. Bottom: ratio between the projected total mass profiles obtained for the different colour-coded models and the NoES-Model.
Current usage metrics show cumulative count of Article Views (full-text article views including HTML views, PDF and ePub downloads, according to the available data) and Abstracts Views on Vision4Press platform.
Data correspond to usage on the plateform after 2015. The current usage metrics is available 48-96 hours after online publication and is updated daily on week days.
Initial download of the metrics may take a while.