Fig. 5.
Download original image
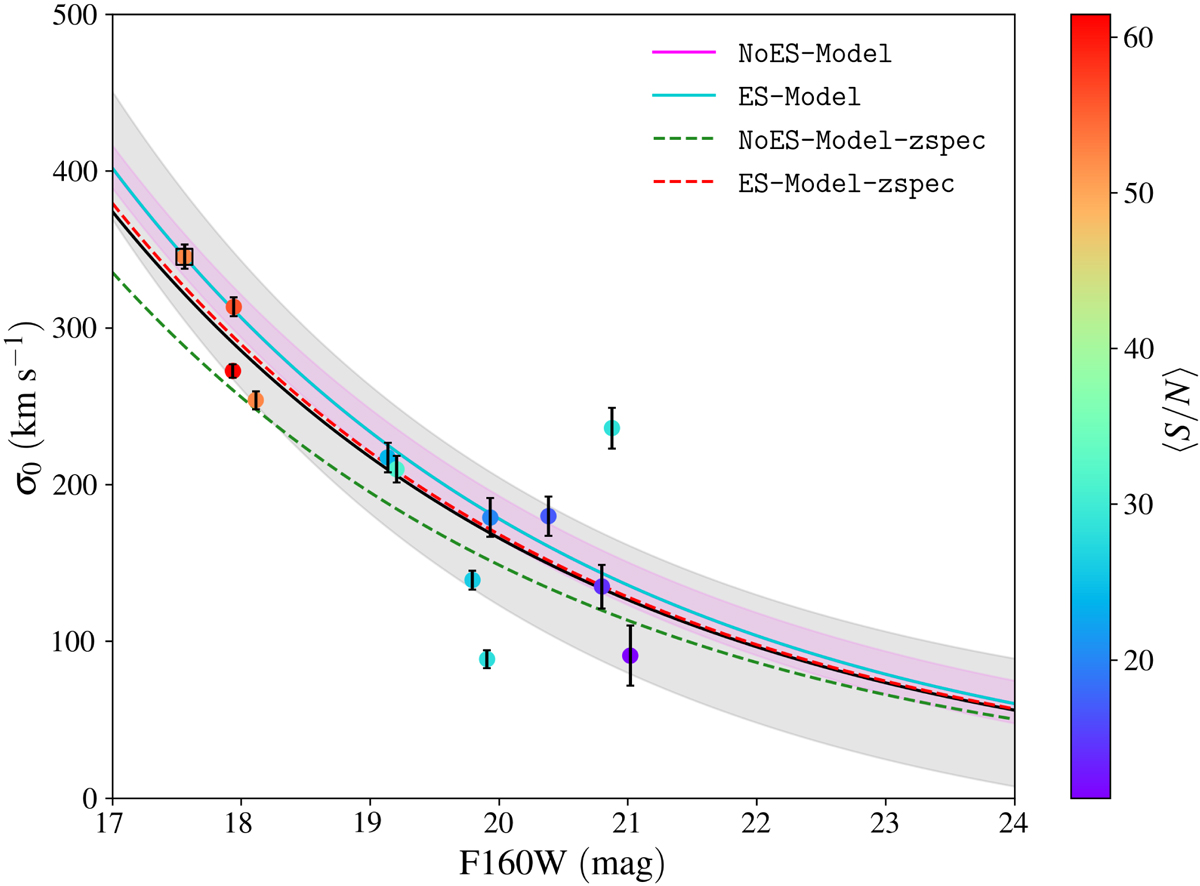
Measured stellar velocity dispersions for a sub-sample of 13 cluster members as a function of their magnitudes in the HST F160W band (filled circles, colour-coded according to their spectral ⟨S/N⟩). The black square pinpoints the values of the BCG. The solid black line and shaded area correspond to the best-fit σ0–F160W relation and the 68% confidence interval, respectively (see Sect. 3.2). We note that all the lens models assume the same value of the slope, α, and only the value of the scaling-relation normalisation is optimised within a Gaussian prior centred on the best-fit value of σ0. The solid magenta and cyan lines represent the median σ0–F160W relations for the NoES-Model and ES-Model, respectively. The resulting relations from the two lens models are consistent and do completely overlap. The dashed lines show the median relations for the corresponding SL models that only include the spectroscopic sample of multiple images. For visual clarity, we only show the 1σ statistical uncertainties for the NoES-Model (magenta shaded area).
Current usage metrics show cumulative count of Article Views (full-text article views including HTML views, PDF and ePub downloads, according to the available data) and Abstracts Views on Vision4Press platform.
Data correspond to usage on the plateform after 2015. The current usage metrics is available 48-96 hours after online publication and is updated daily on week days.
Initial download of the metrics may take a while.