Fig. 4.
Download original image
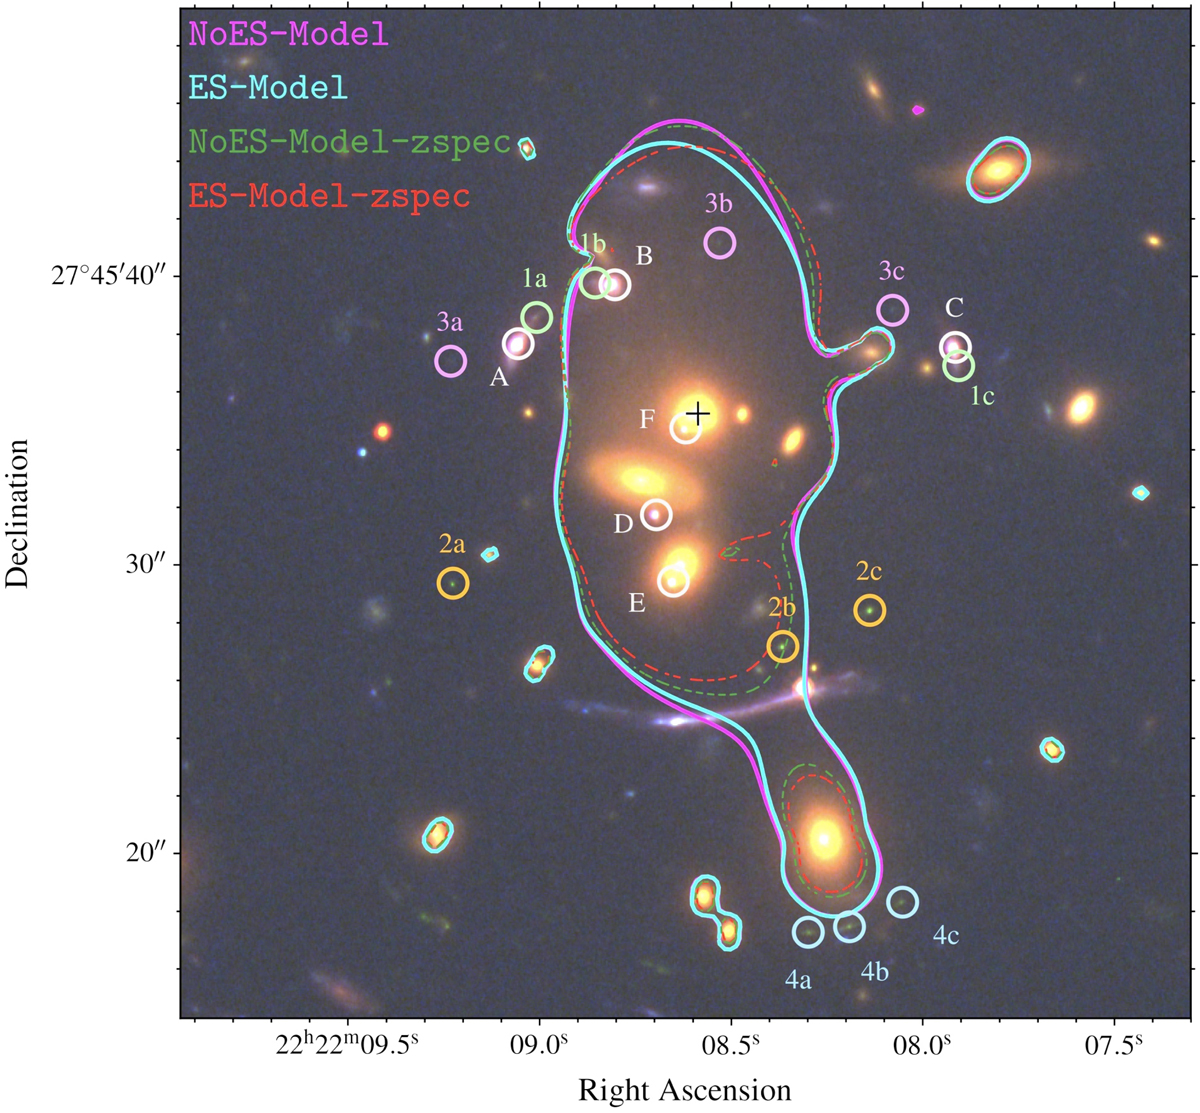
Red-green-blue image of the central region of SDSS 2222, showing the multiply imaged sources that have been identified (see also Table 1). We overlay the best-fit critical curves at the quasar redshift (z = 2.801) from the models presented in this work. The solid and dashed lines display the critical curves for the associated models considering, respectively, the full and spectroscopic-only multiple image samples. The black cross indicates the reference position, corresponding to the luminosity centroid of the BCG (ID 2010), from which the cumulative projected total mass profiles are computed.
Current usage metrics show cumulative count of Article Views (full-text article views including HTML views, PDF and ePub downloads, according to the available data) and Abstracts Views on Vision4Press platform.
Data correspond to usage on the plateform after 2015. The current usage metrics is available 48-96 hours after online publication and is updated daily on week days.
Initial download of the metrics may take a while.