Fig. 2.
Download original image
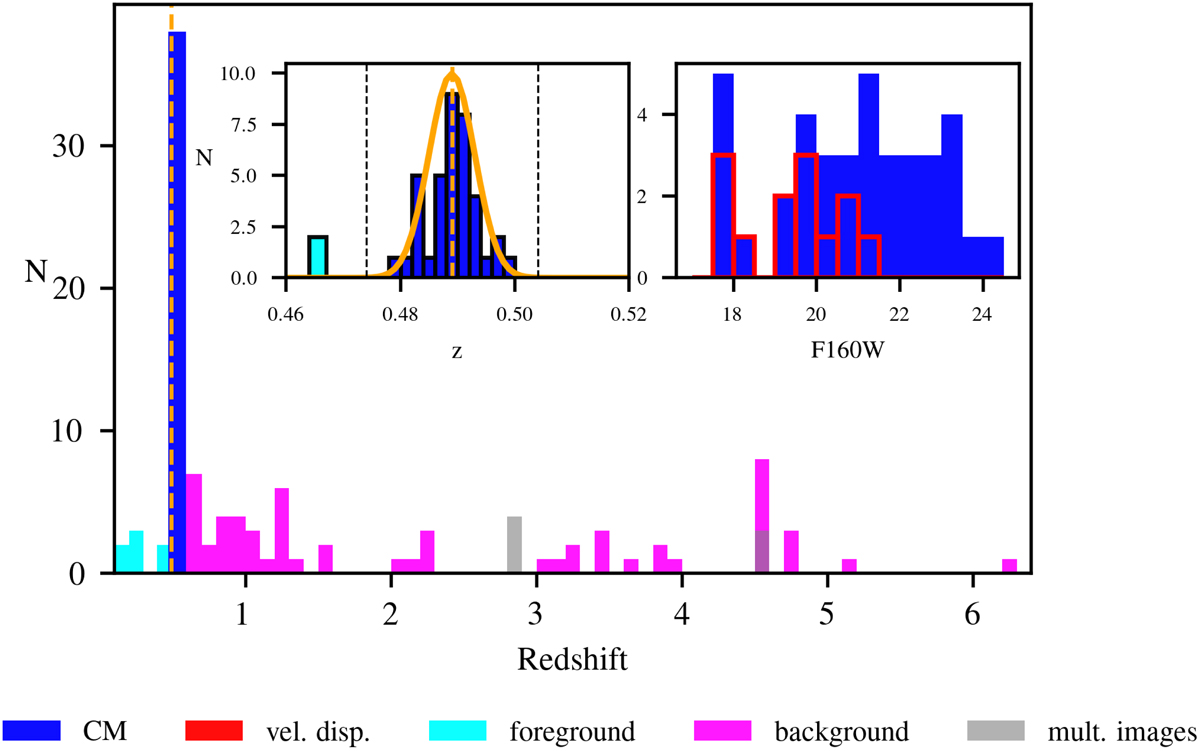
MUSE spectroscopic redshift distribution of the objects with a QF ≥ 2 identified in the SDSS 2222 cluster field. The top-left inset shows a zoomed-in view around the cluster redshift z = 0.489, as shown by the mean value of the Gaussian distribution (in orange). The vertical dashed black lines locate the redshift interval [0.474–0.504], which includes the 34 spectroscopically confirmed MUSE cluster members. The top-right inset shows the distribution of cluster members as a function of their magnitudes in the F160W HST band. The same colour code as in Fig. 1 is adopted. The multiple images are marked in grey.
Current usage metrics show cumulative count of Article Views (full-text article views including HTML views, PDF and ePub downloads, according to the available data) and Abstracts Views on Vision4Press platform.
Data correspond to usage on the plateform after 2015. The current usage metrics is available 48-96 hours after online publication and is updated daily on week days.
Initial download of the metrics may take a while.