Fig. 9.
Download original image
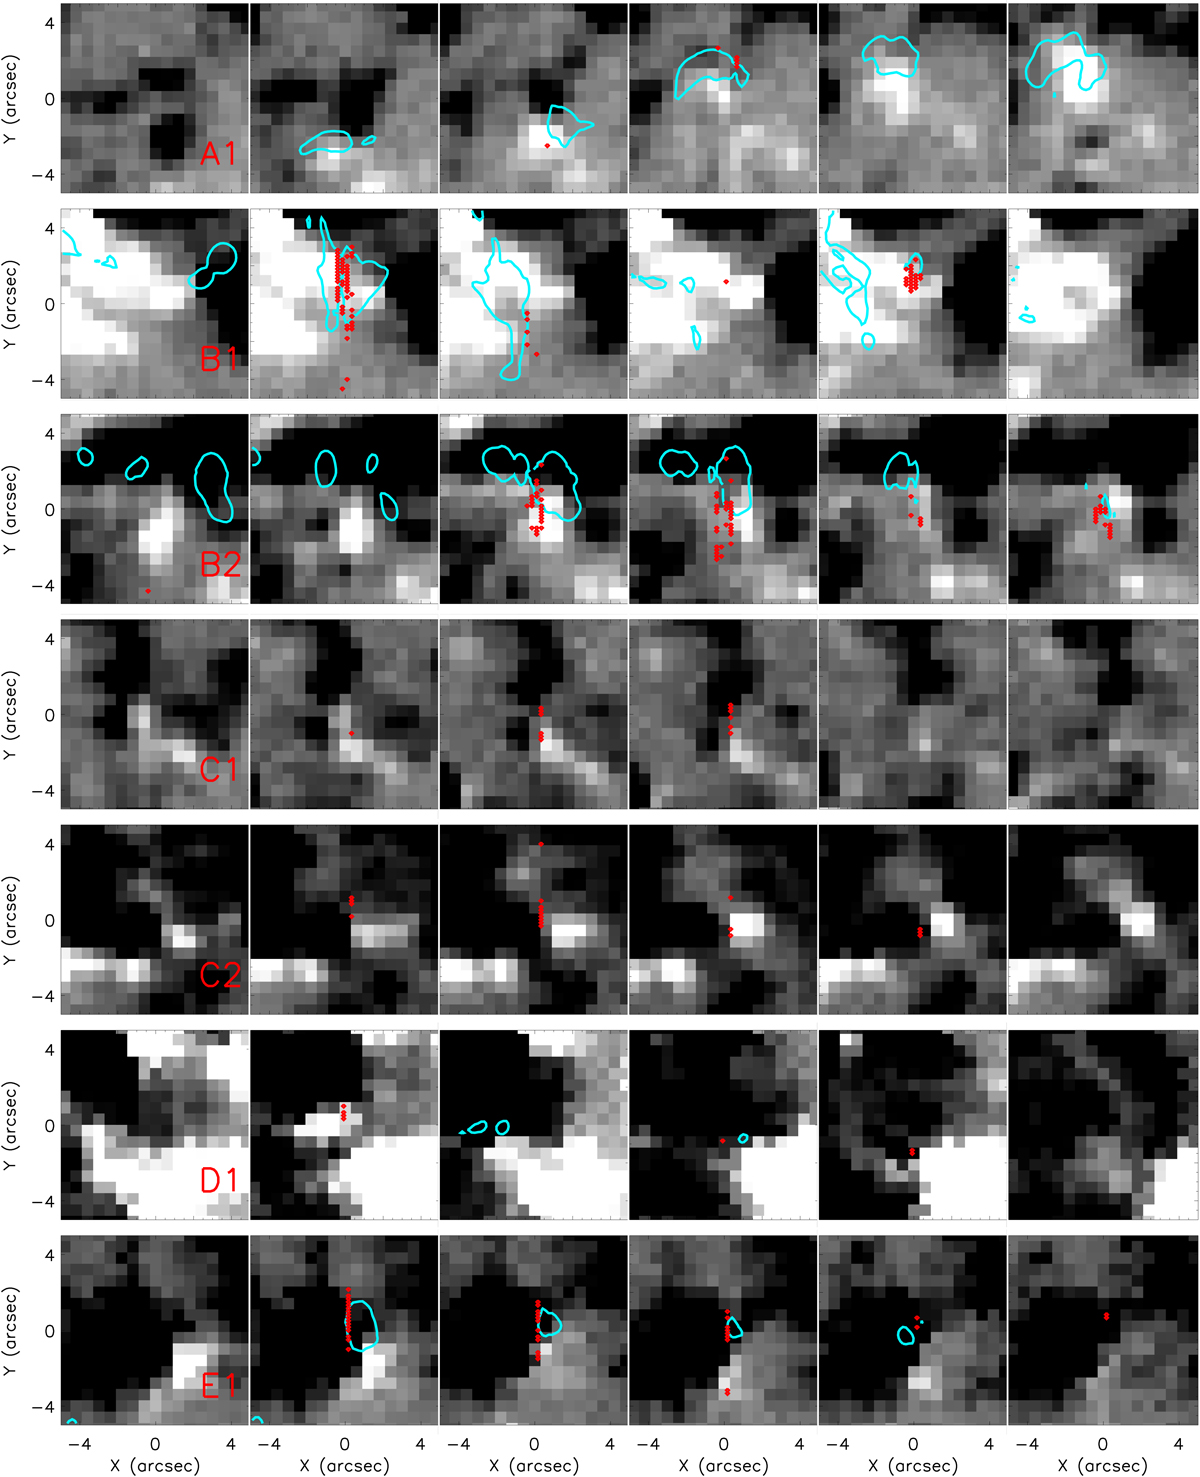
Time series displaying the evolution of the line of sight magnetic field during the seven regions (with each row being labelled in the left-hand panel) that contained the majority of IRIS burst profiles identified here. The left-most panel corresponds to the first time-step of the region, while the right-most panel corresponds to the final time-step. The other panels were sampled at equal cadences between these two times. The red points indicate the approximate locations of the IRIS burst profiles identified by applying our automated methods to the temporally closest raster (A1 was observed by a two-step raster; B1 and B2 were observed by a four-step raster), whilst the aqua contours indicate the regions in the co-spatial and co-temporal IRIS 1400 Å SJI filter data that had intensities above 500 DN/s. It is important to note that some panels contain no IRIS burst profiles. Opposite polarity magnetic fields were observed to interact throughout the duration of each of these regions.
Current usage metrics show cumulative count of Article Views (full-text article views including HTML views, PDF and ePub downloads, according to the available data) and Abstracts Views on Vision4Press platform.
Data correspond to usage on the plateform after 2015. The current usage metrics is available 48-96 hours after online publication and is updated daily on week days.
Initial download of the metrics may take a while.