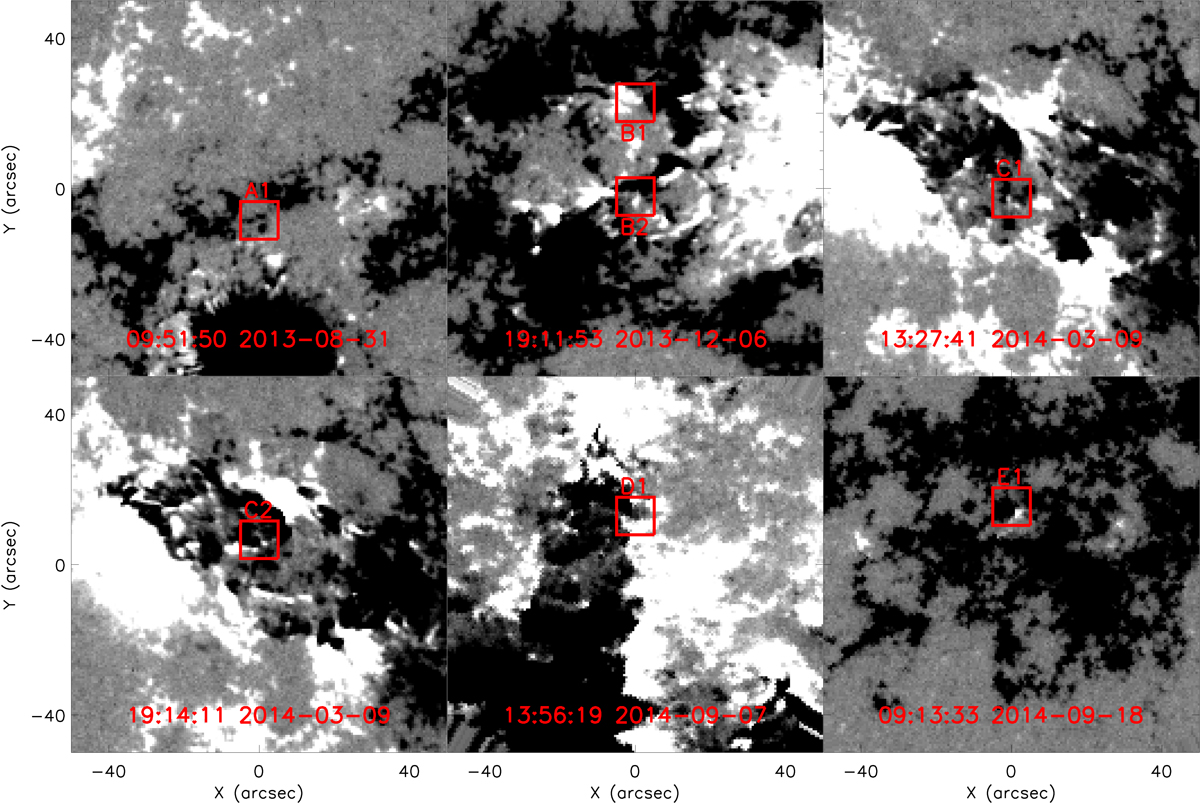
Fig. 8.
Download original image
SDO/HMI line of sight magnetic field maps saturated at ±100 G for 100″ × 100″ FOVs co-spatial to the IRIS SJI data. These maps were constructed using the SDO/HMI frame that was closest in time to the IRIS raster identified as the start-time of each of the seven regions discussed in detail here. The red labelled boxes indicate the approximate locations of each of these regions and outline the FOVs plotted at six time-steps in Fig. 9. Notably, B1 and B2 share a first time-step and, therefore, share a panel.
Current usage metrics show cumulative count of Article Views (full-text article views including HTML views, PDF and ePub downloads, according to the available data) and Abstracts Views on Vision4Press platform.
Data correspond to usage on the plateform after 2015. The current usage metrics is available 48-96 hours after online publication and is updated daily on week days.
Initial download of the metrics may take a while.