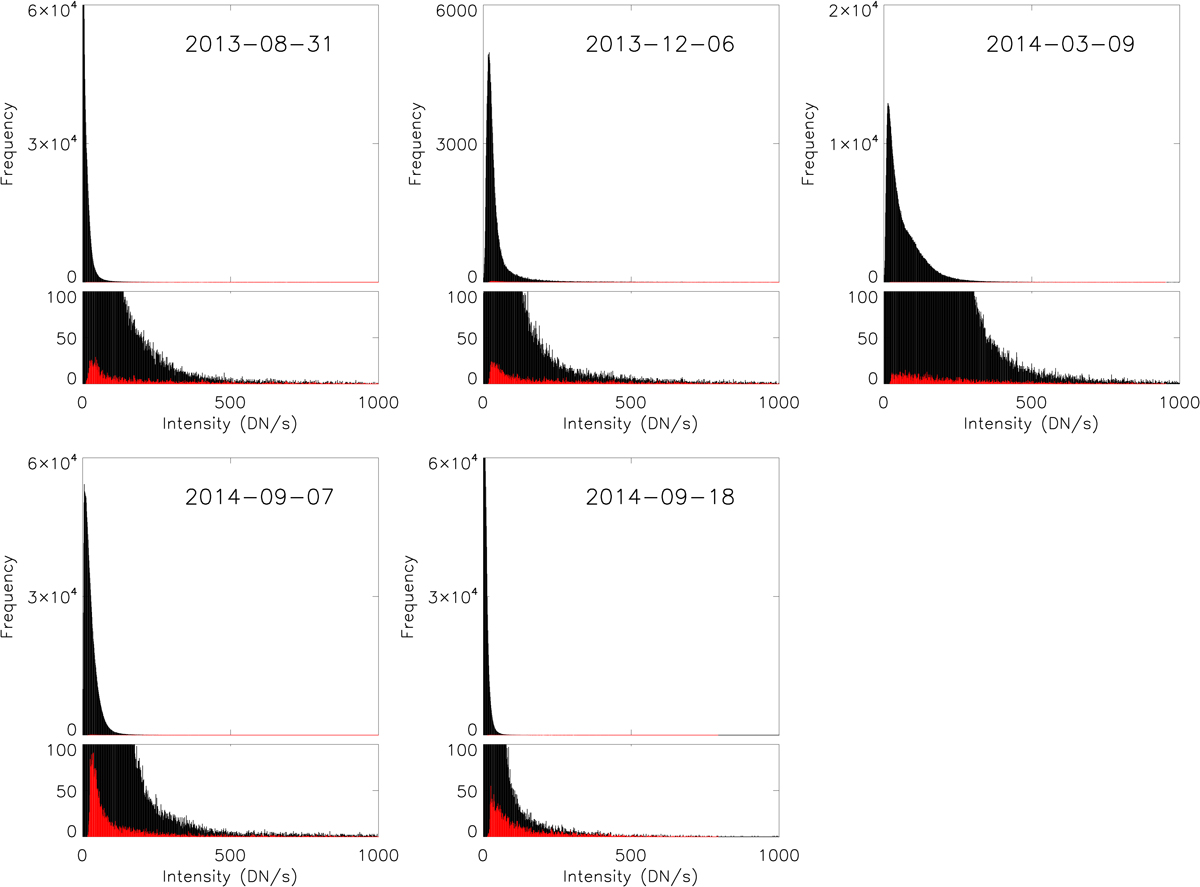
Fig. 7.
Download original image
Distributions of the Si IV 1394 Å line core (rest wavelength) intensity for the five datasets studied here. Large panels: Histograms of the intensity for each pixel within the rasters studied here (black bars), as well as the intensity only at locations where IRIS burst profiles were detected (red bars). Small panels: Same as above but with the y-axis scaled to better display the red bars. Clearly, IRIS burst profiles were not confined to only the brightest pixels in the FOVs.
Current usage metrics show cumulative count of Article Views (full-text article views including HTML views, PDF and ePub downloads, according to the available data) and Abstracts Views on Vision4Press platform.
Data correspond to usage on the plateform after 2015. The current usage metrics is available 48-96 hours after online publication and is updated daily on week days.
Initial download of the metrics may take a while.