Open Access
Fig. 6.
Download original image
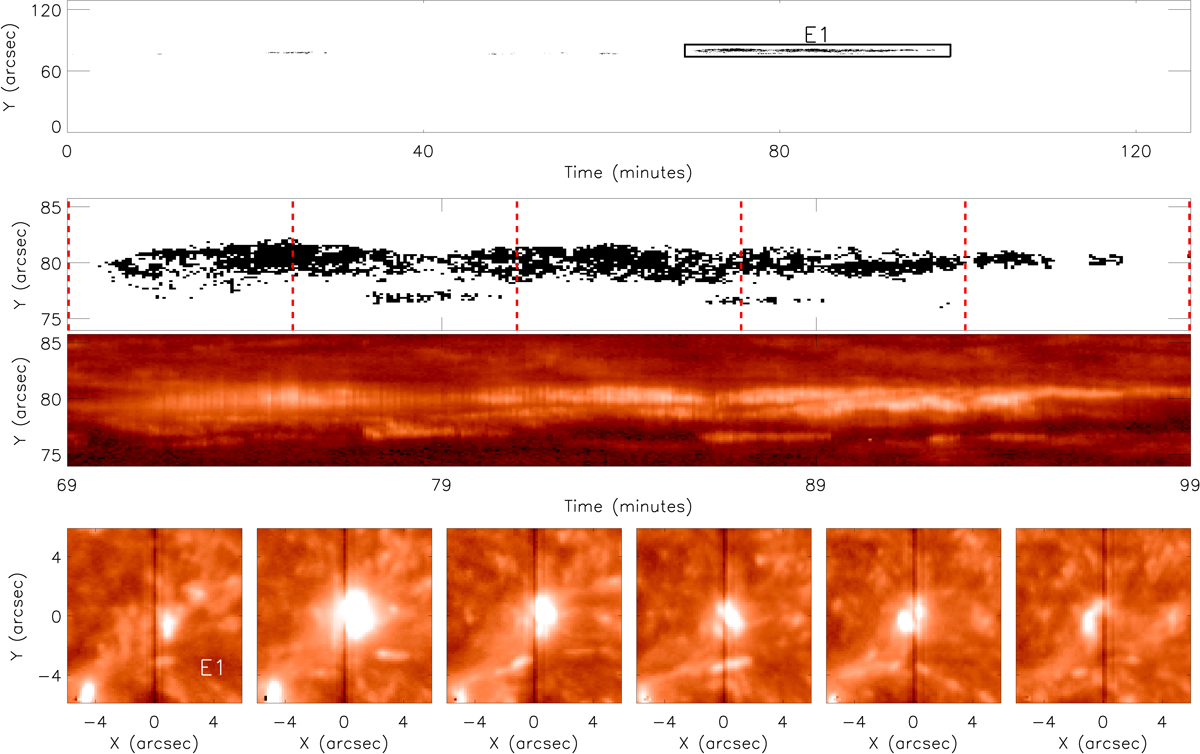
Same as for Fig. 2 but for the dataset sampled on 18 September 2014. The region containing the majority of IRIS burst profiles is highlighted by the black box labelled ‘E1’.
Current usage metrics show cumulative count of Article Views (full-text article views including HTML views, PDF and ePub downloads, according to the available data) and Abstracts Views on Vision4Press platform.
Data correspond to usage on the plateform after 2015. The current usage metrics is available 48-96 hours after online publication and is updated daily on week days.
Initial download of the metrics may take a while.