Fig. 3.
Download original image
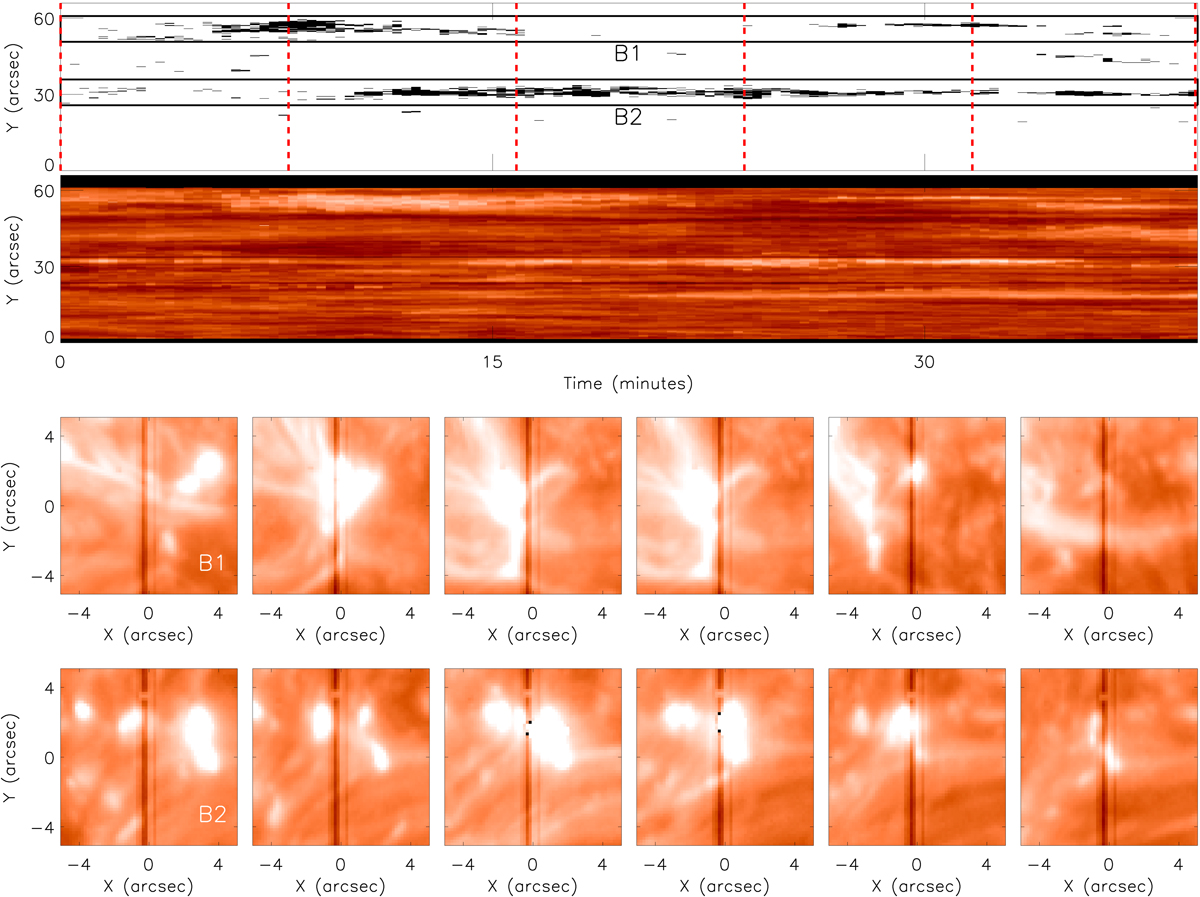
Similar to Fig. 2, but for the dataset sampled on 6 December 2013. Top row: binary time–distance plot displaying the locations of IRIS burst profiles throughout this 40 min dataset. The black boxes labelled ‘B1’ and ‘B2’ indicate two regions of increased IRIS burst activity along the slit, whilst the vertical dashed red lines indicate the times at which the SJI data panels plotted in the bottom two panels were sampled. Second row: Si IV 1394 Å line core (rest wavelength) intensity (logarithmically scaled) co-spatial to the binary map plotted above. Third row: six zoomed-in FOVs from the SJI data (logarithmically scaleds) with the y-axis being equal to the height of B1. Bottom row: same as for the third row but for B2.
Current usage metrics show cumulative count of Article Views (full-text article views including HTML views, PDF and ePub downloads, according to the available data) and Abstracts Views on Vision4Press platform.
Data correspond to usage on the plateform after 2015. The current usage metrics is available 48-96 hours after online publication and is updated daily on week days.
Initial download of the metrics may take a while.