Fig. 2.
Download original image
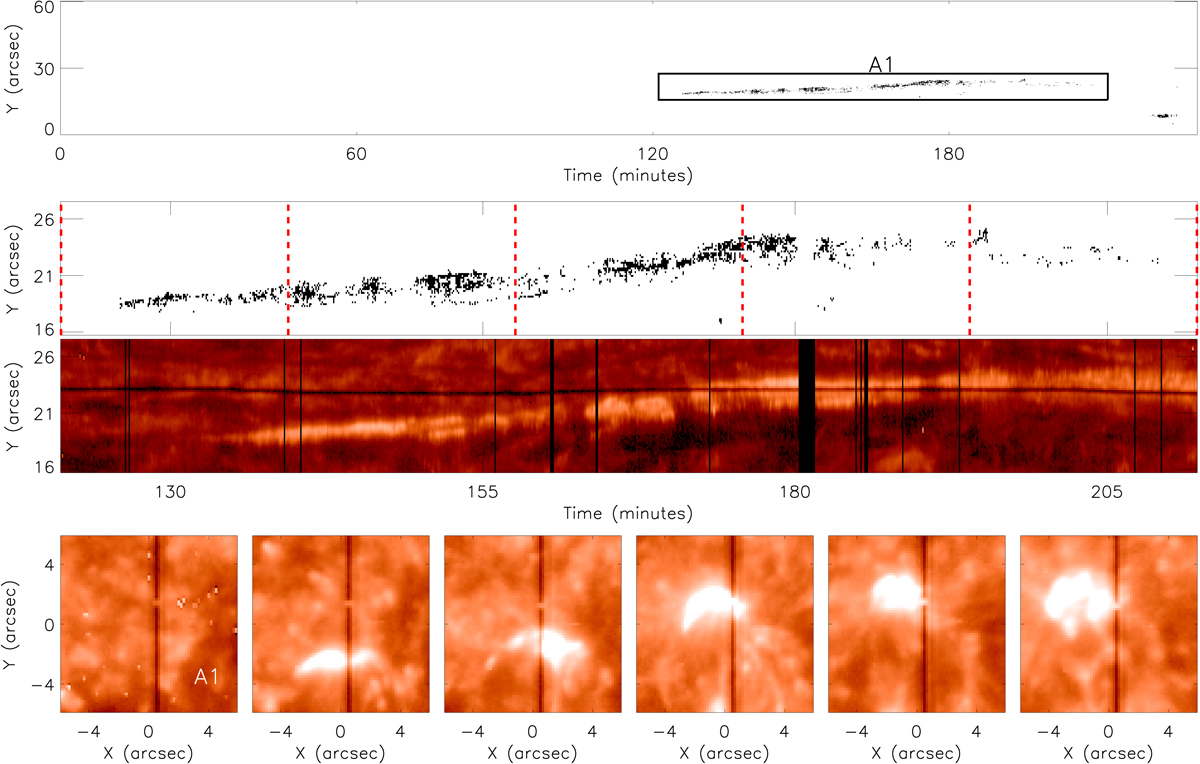
Properties of the IRIS burst profiles within the dataset sampled on 31 August 2013. Top row: time–distance binary map for the entire dataset, with black pixels pin-pointing IRIS burst profiles identified using our algorithm. The majority (91.57%) of IRIS burst profiles are contained within a small region highlighted by the box labelled ‘A1’. Second row: time–distance binary map plotting only the region within A1. The vertical dashed red lines indicate the times of the SJI 1400 Å images plotted in the bottom row. Third row: time–distance intensity map (logarithmically scaled) calculated from the Si IV 1394 Å line core (rest wavelength) co-spatial to the FOV plotted in the second row. The vertical black lines denote regions where no data was returned. Bottom row: six 1400 Å SJI frames (logarithmically scaled) sampled over the 90 min covered by A1. Clearly no compact brightening is initially present (first panel), before one appears (second panel), moves upwards parallel to the IRIS slit (third to fifth panels), before moving to the left of the slit (sixth panel) such that it was no longer detectable in the spectral data.
Current usage metrics show cumulative count of Article Views (full-text article views including HTML views, PDF and ePub downloads, according to the available data) and Abstracts Views on Vision4Press platform.
Data correspond to usage on the plateform after 2015. The current usage metrics is available 48-96 hours after online publication and is updated daily on week days.
Initial download of the metrics may take a while.