Fig. 1.
Download original image
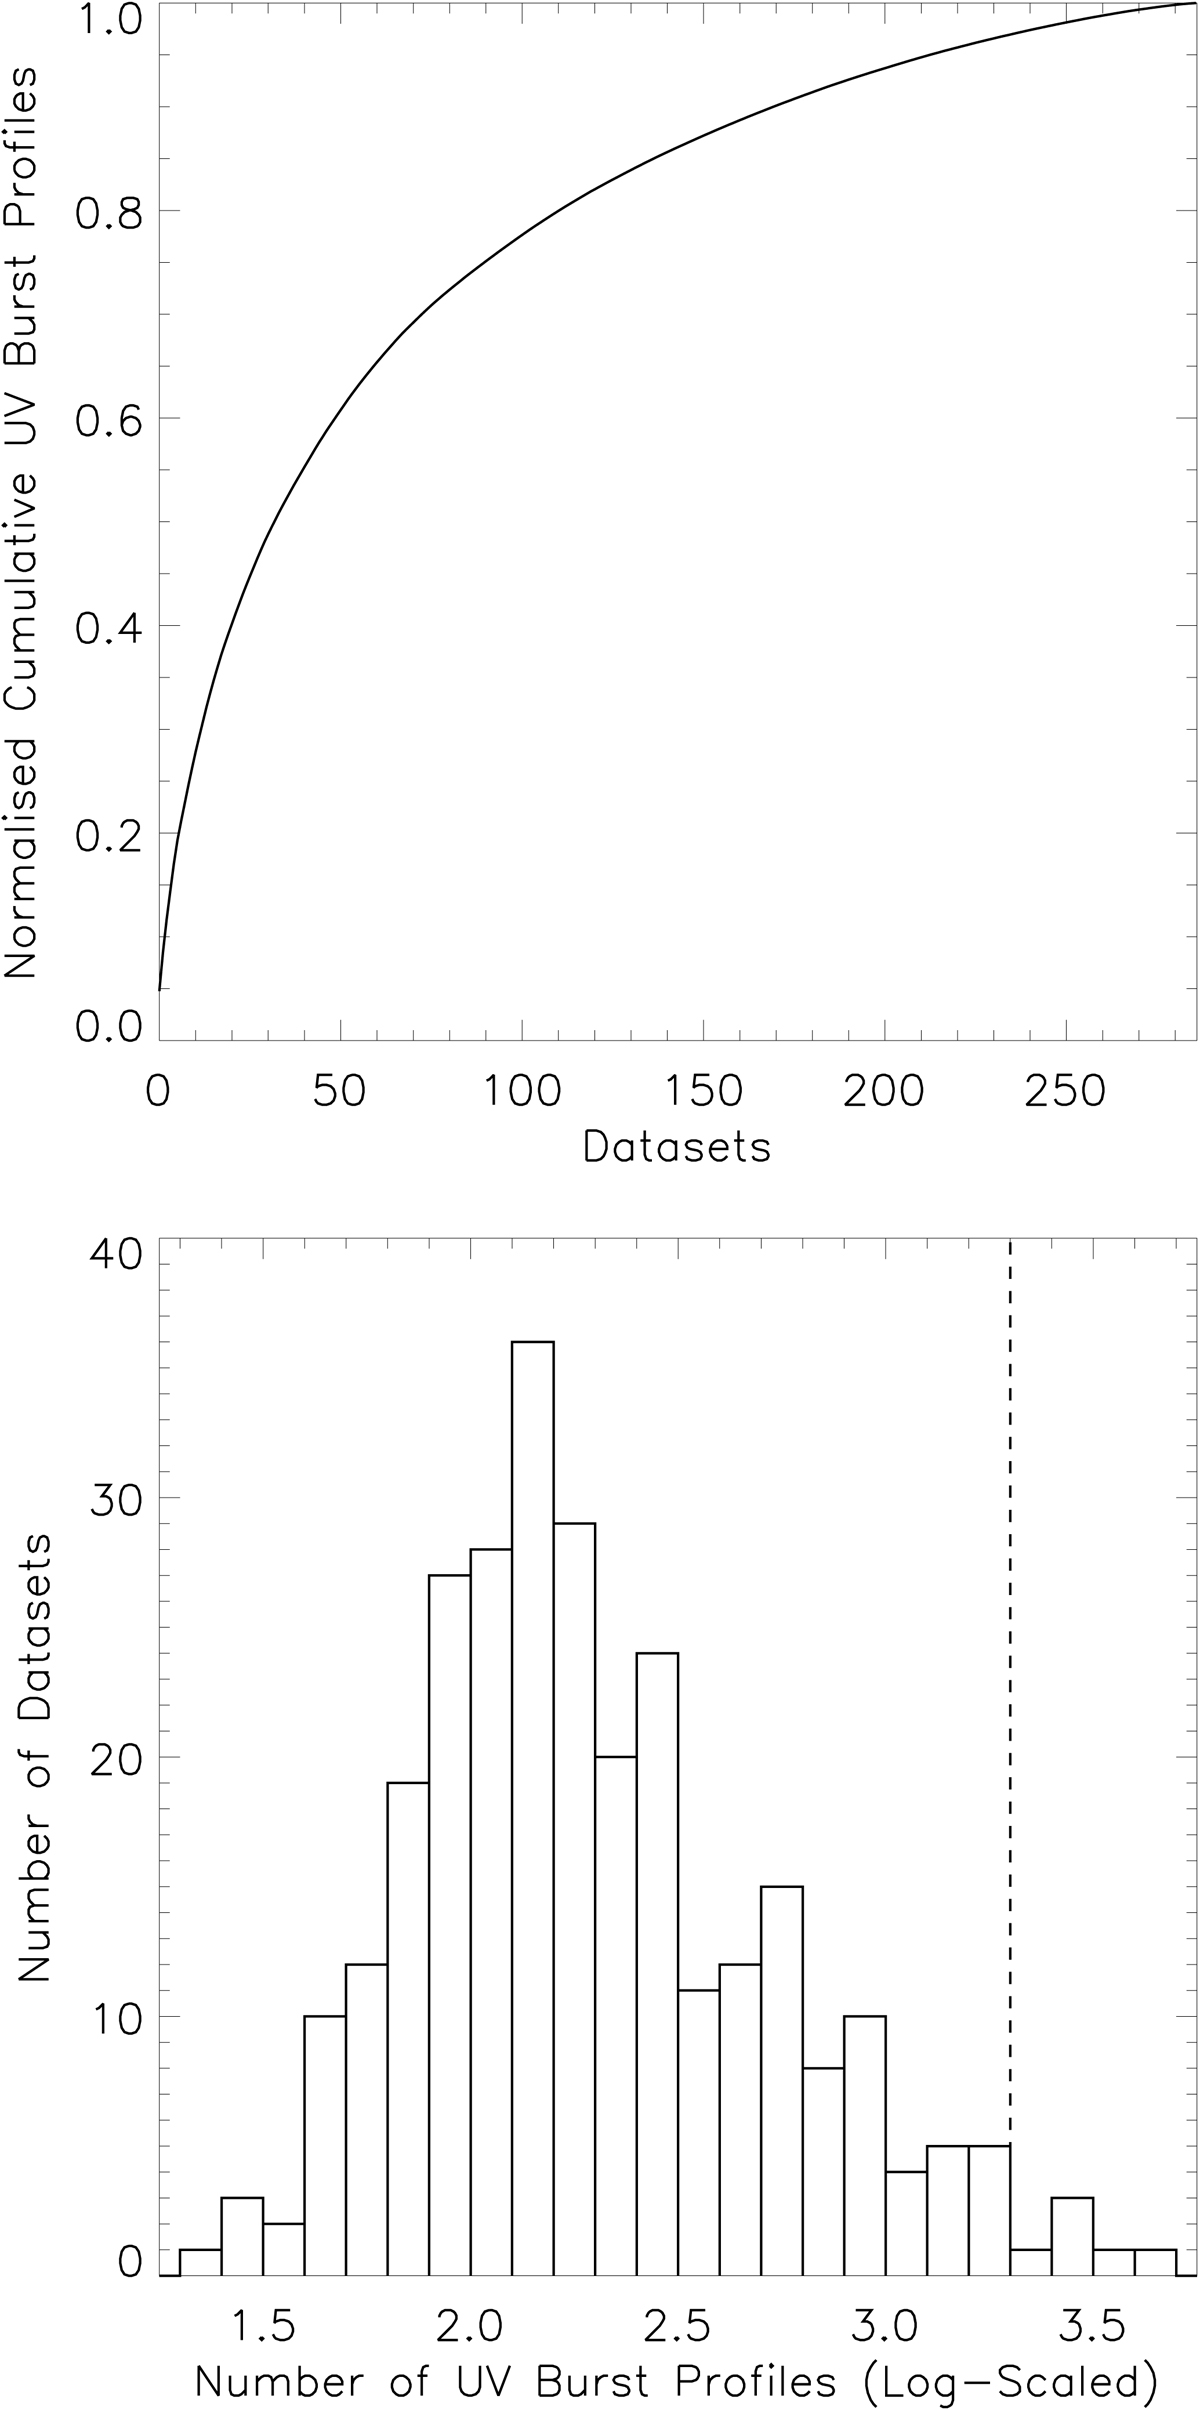
General statistics of IRIS burst profiles from the sample of Kleint & Panos (2022). Top panel: CDF for the total number of IRIS burst profiles across all 287 datasets found to contain such spectra, clearly demonstrating that these events are not evenly distributed. Bottom panel: histogram plotting the number of datasets containing specific numbers of IRIS burst profiles. The vertical dashed line indicates the cut-off used here to define high IRIS burst prevalence, with five of the six datasets to the right being studied in this article.
Current usage metrics show cumulative count of Article Views (full-text article views including HTML views, PDF and ePub downloads, according to the available data) and Abstracts Views on Vision4Press platform.
Data correspond to usage on the plateform after 2015. The current usage metrics is available 48-96 hours after online publication and is updated daily on week days.
Initial download of the metrics may take a while.