Fig. 3
Download original image
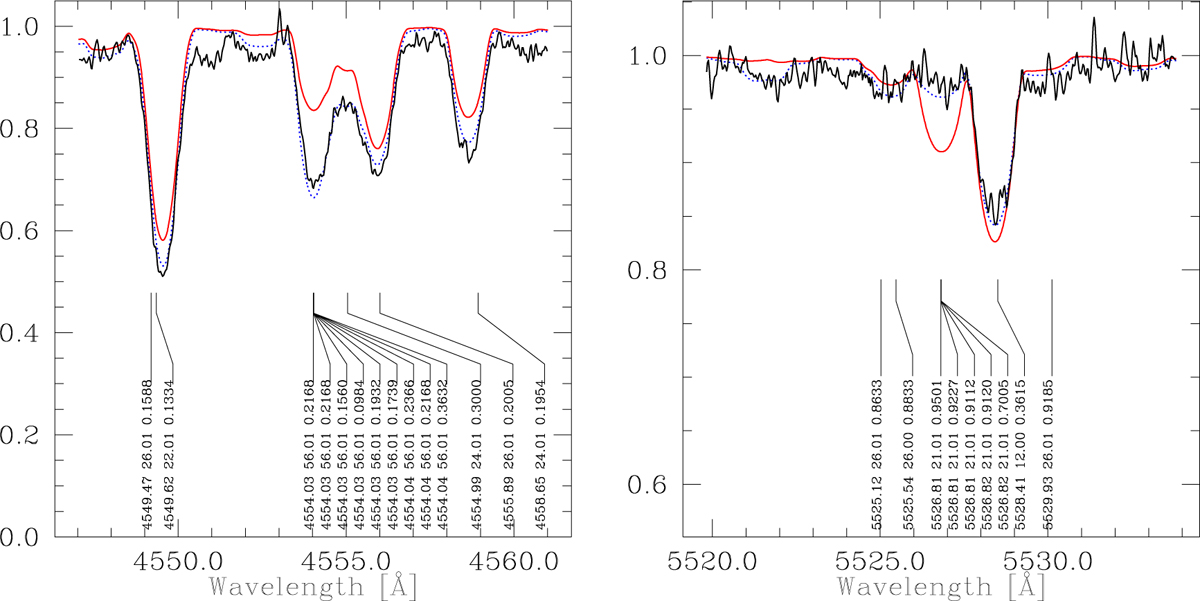
Observed spectra of the star HATS-70 (black) compared to synthetic spectra with our abundances (blue dotted) and adopting a solar composition (red). The two panels correspond to two different spectral regions. Line identifications present the wavelength, atomic number (with ionization state as decimals), and intensity (between 1 and 0).
Current usage metrics show cumulative count of Article Views (full-text article views including HTML views, PDF and ePub downloads, according to the available data) and Abstracts Views on Vision4Press platform.
Data correspond to usage on the plateform after 2015. The current usage metrics is available 48-96 hours after online publication and is updated daily on week days.
Initial download of the metrics may take a while.