Open Access
Fig. 6.
Download original image
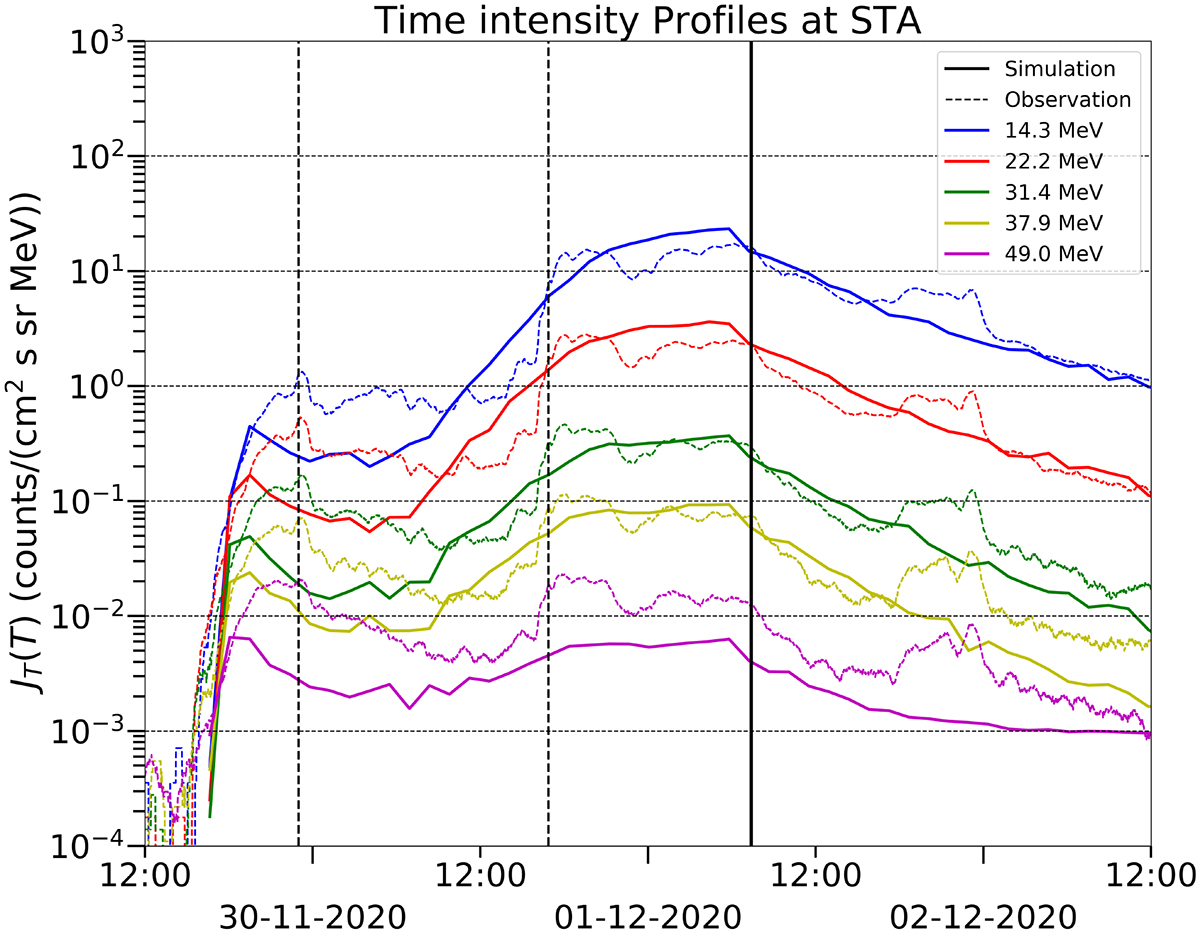
Time-intensity profiles from the STA observation (dashed lines) and the model calculation (solid lines). Solid vertical line marks the shock arrival at the STA in the observation and dashed vertical lines indicate the heliospheric plasma sheets.
Current usage metrics show cumulative count of Article Views (full-text article views including HTML views, PDF and ePub downloads, according to the available data) and Abstracts Views on Vision4Press platform.
Data correspond to usage on the plateform after 2015. The current usage metrics is available 48-96 hours after online publication and is updated daily on week days.
Initial download of the metrics may take a while.