Open Access
Fig. 2.
Download original image
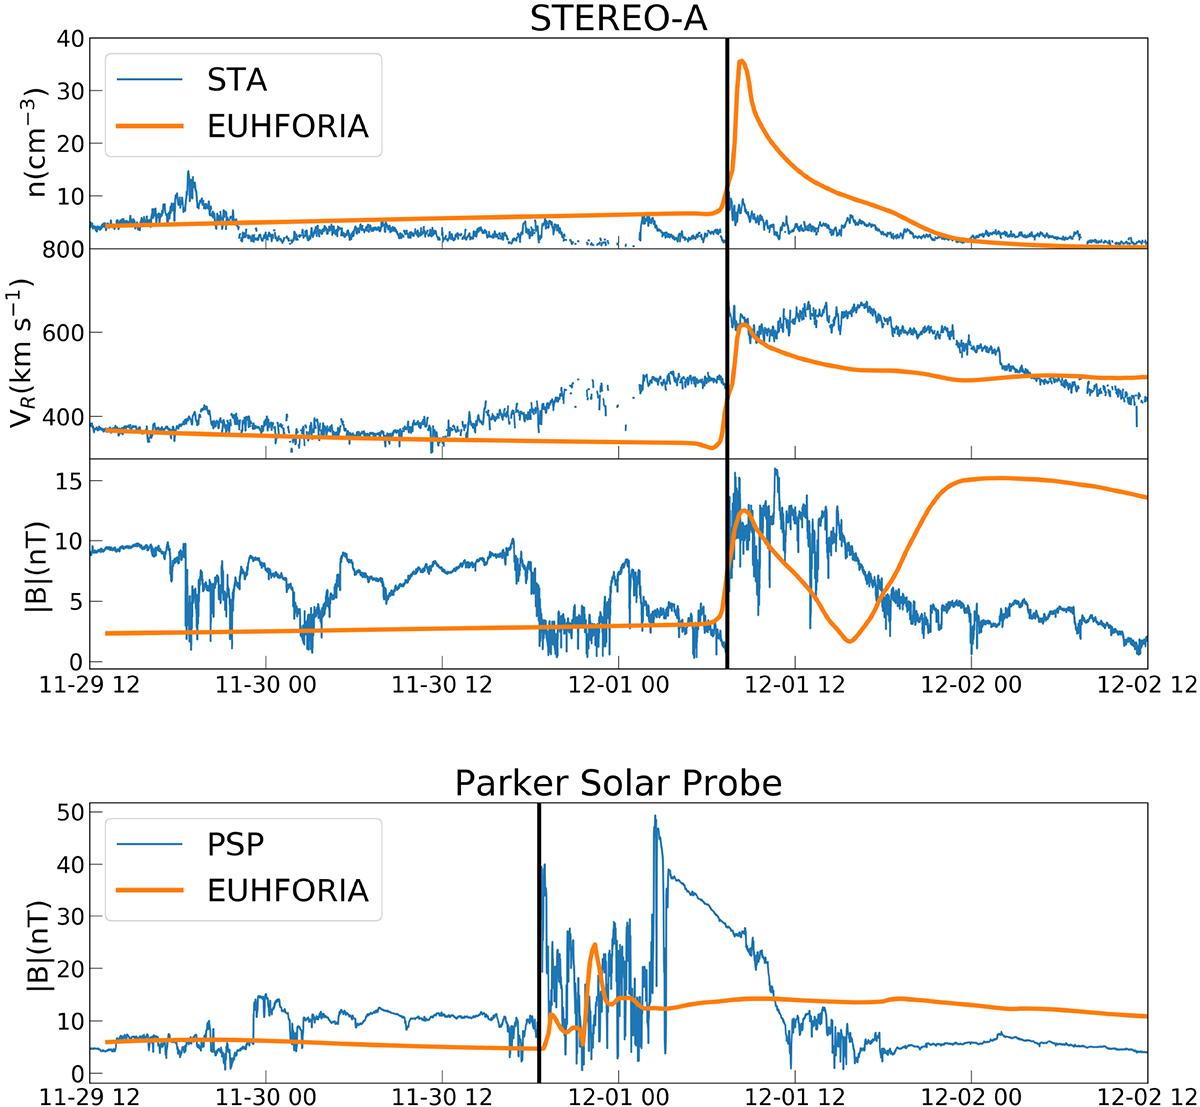
Time series of the modeled plasma and magnetic field parameters at STA and PSP. The blue lines indicate the in-situ observations and the orange lines show the modeled results of EUHFORIA. The vertical solid lines indicate the shock arrival time at STEREO-A and PSP (see text for details).
Current usage metrics show cumulative count of Article Views (full-text article views including HTML views, PDF and ePub downloads, according to the available data) and Abstracts Views on Vision4Press platform.
Data correspond to usage on the plateform after 2015. The current usage metrics is available 48-96 hours after online publication and is updated daily on week days.
Initial download of the metrics may take a while.