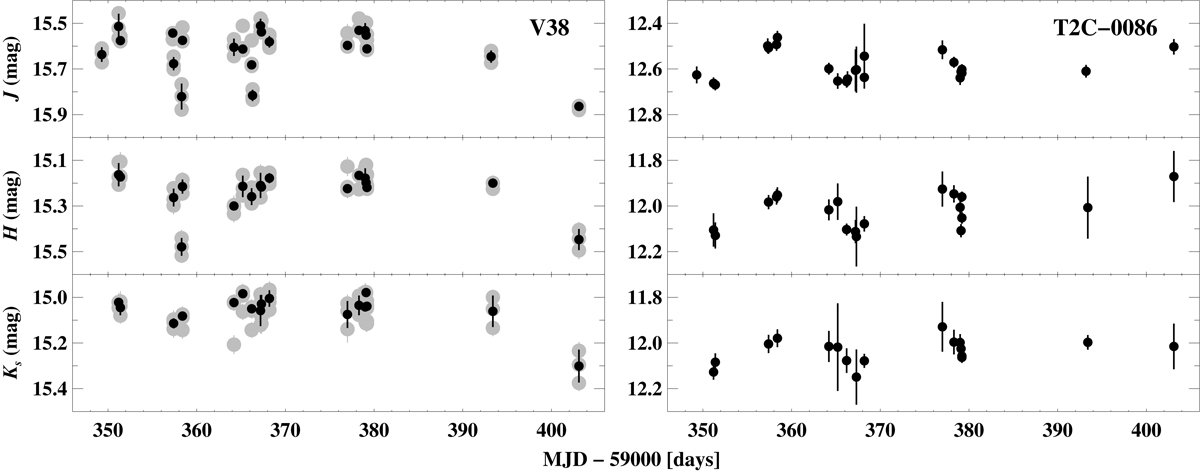
Fig. 2.
Download original image
Near-infrared light curves of an RRL variable (left) found in all dithered frames and a T2C (right) located in the outskirt of one of the dithered frames at each epoch. Left: gray symbols show all photometric measurements (see Nf columns in Table 1) obtained from the dithered frames at a given epoch, and the black symbols represent the weighted mean magnitudes. Right: no weighted averaging was performed.
Current usage metrics show cumulative count of Article Views (full-text article views including HTML views, PDF and ePub downloads, according to the available data) and Abstracts Views on Vision4Press platform.
Data correspond to usage on the plateform after 2015. The current usage metrics is available 48-96 hours after online publication and is updated daily on week days.
Initial download of the metrics may take a while.