Fig. 4
Download original image
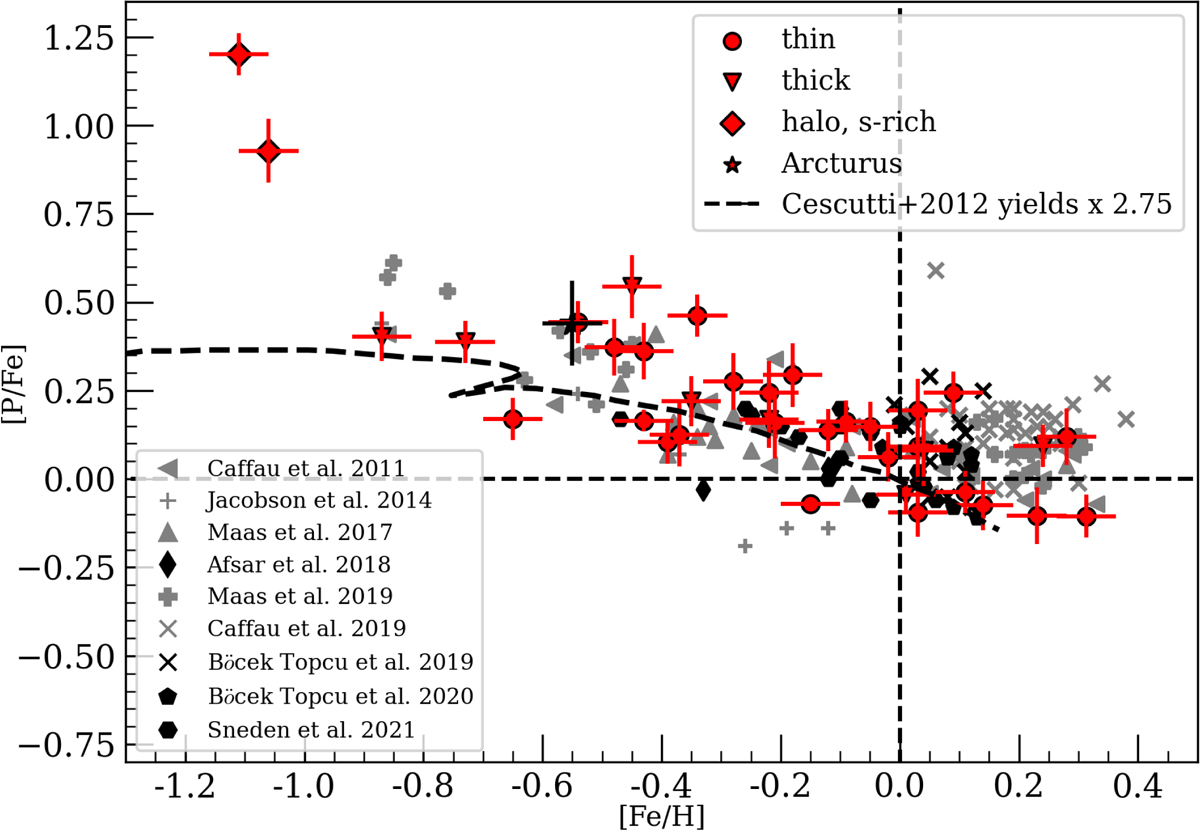
[P/Fe] vs. [Fe/H] for stars in our sample (shown in red) with their respective stellar population represented by different symbols (thin disk, circle, thick disk, inverted triangle; and halo, s-rich, diamond). Arcturus, for which phosphorus was determined from the higher resolution atlas spectrum (Hinkle et al. 1995), is indicated by the black star symbol. Phosphorus abundance determinations (all scaled to the solar abundance used in this work: A(P)⊙ = 5.36 and A(Fe)⊙ = 7.45) from multiple literature sources are also plotted in gray (giants in black) and represented by different symbols. With a dashed line, we show the chemical evolution trend in Cescutti et al. (2012) resulting from the core collapse SN (type II) of massive stars with the phosphorus yields from Kobayashi et al. (2006) arbitrarily increased by a factor of 2.75.
Current usage metrics show cumulative count of Article Views (full-text article views including HTML views, PDF and ePub downloads, according to the available data) and Abstracts Views on Vision4Press platform.
Data correspond to usage on the plateform after 2015. The current usage metrics is available 48-96 hours after online publication and is updated daily on week days.
Initial download of the metrics may take a while.